HOUSE_OVERSIGHT_014483.jpg
Extracted Text (OCR)
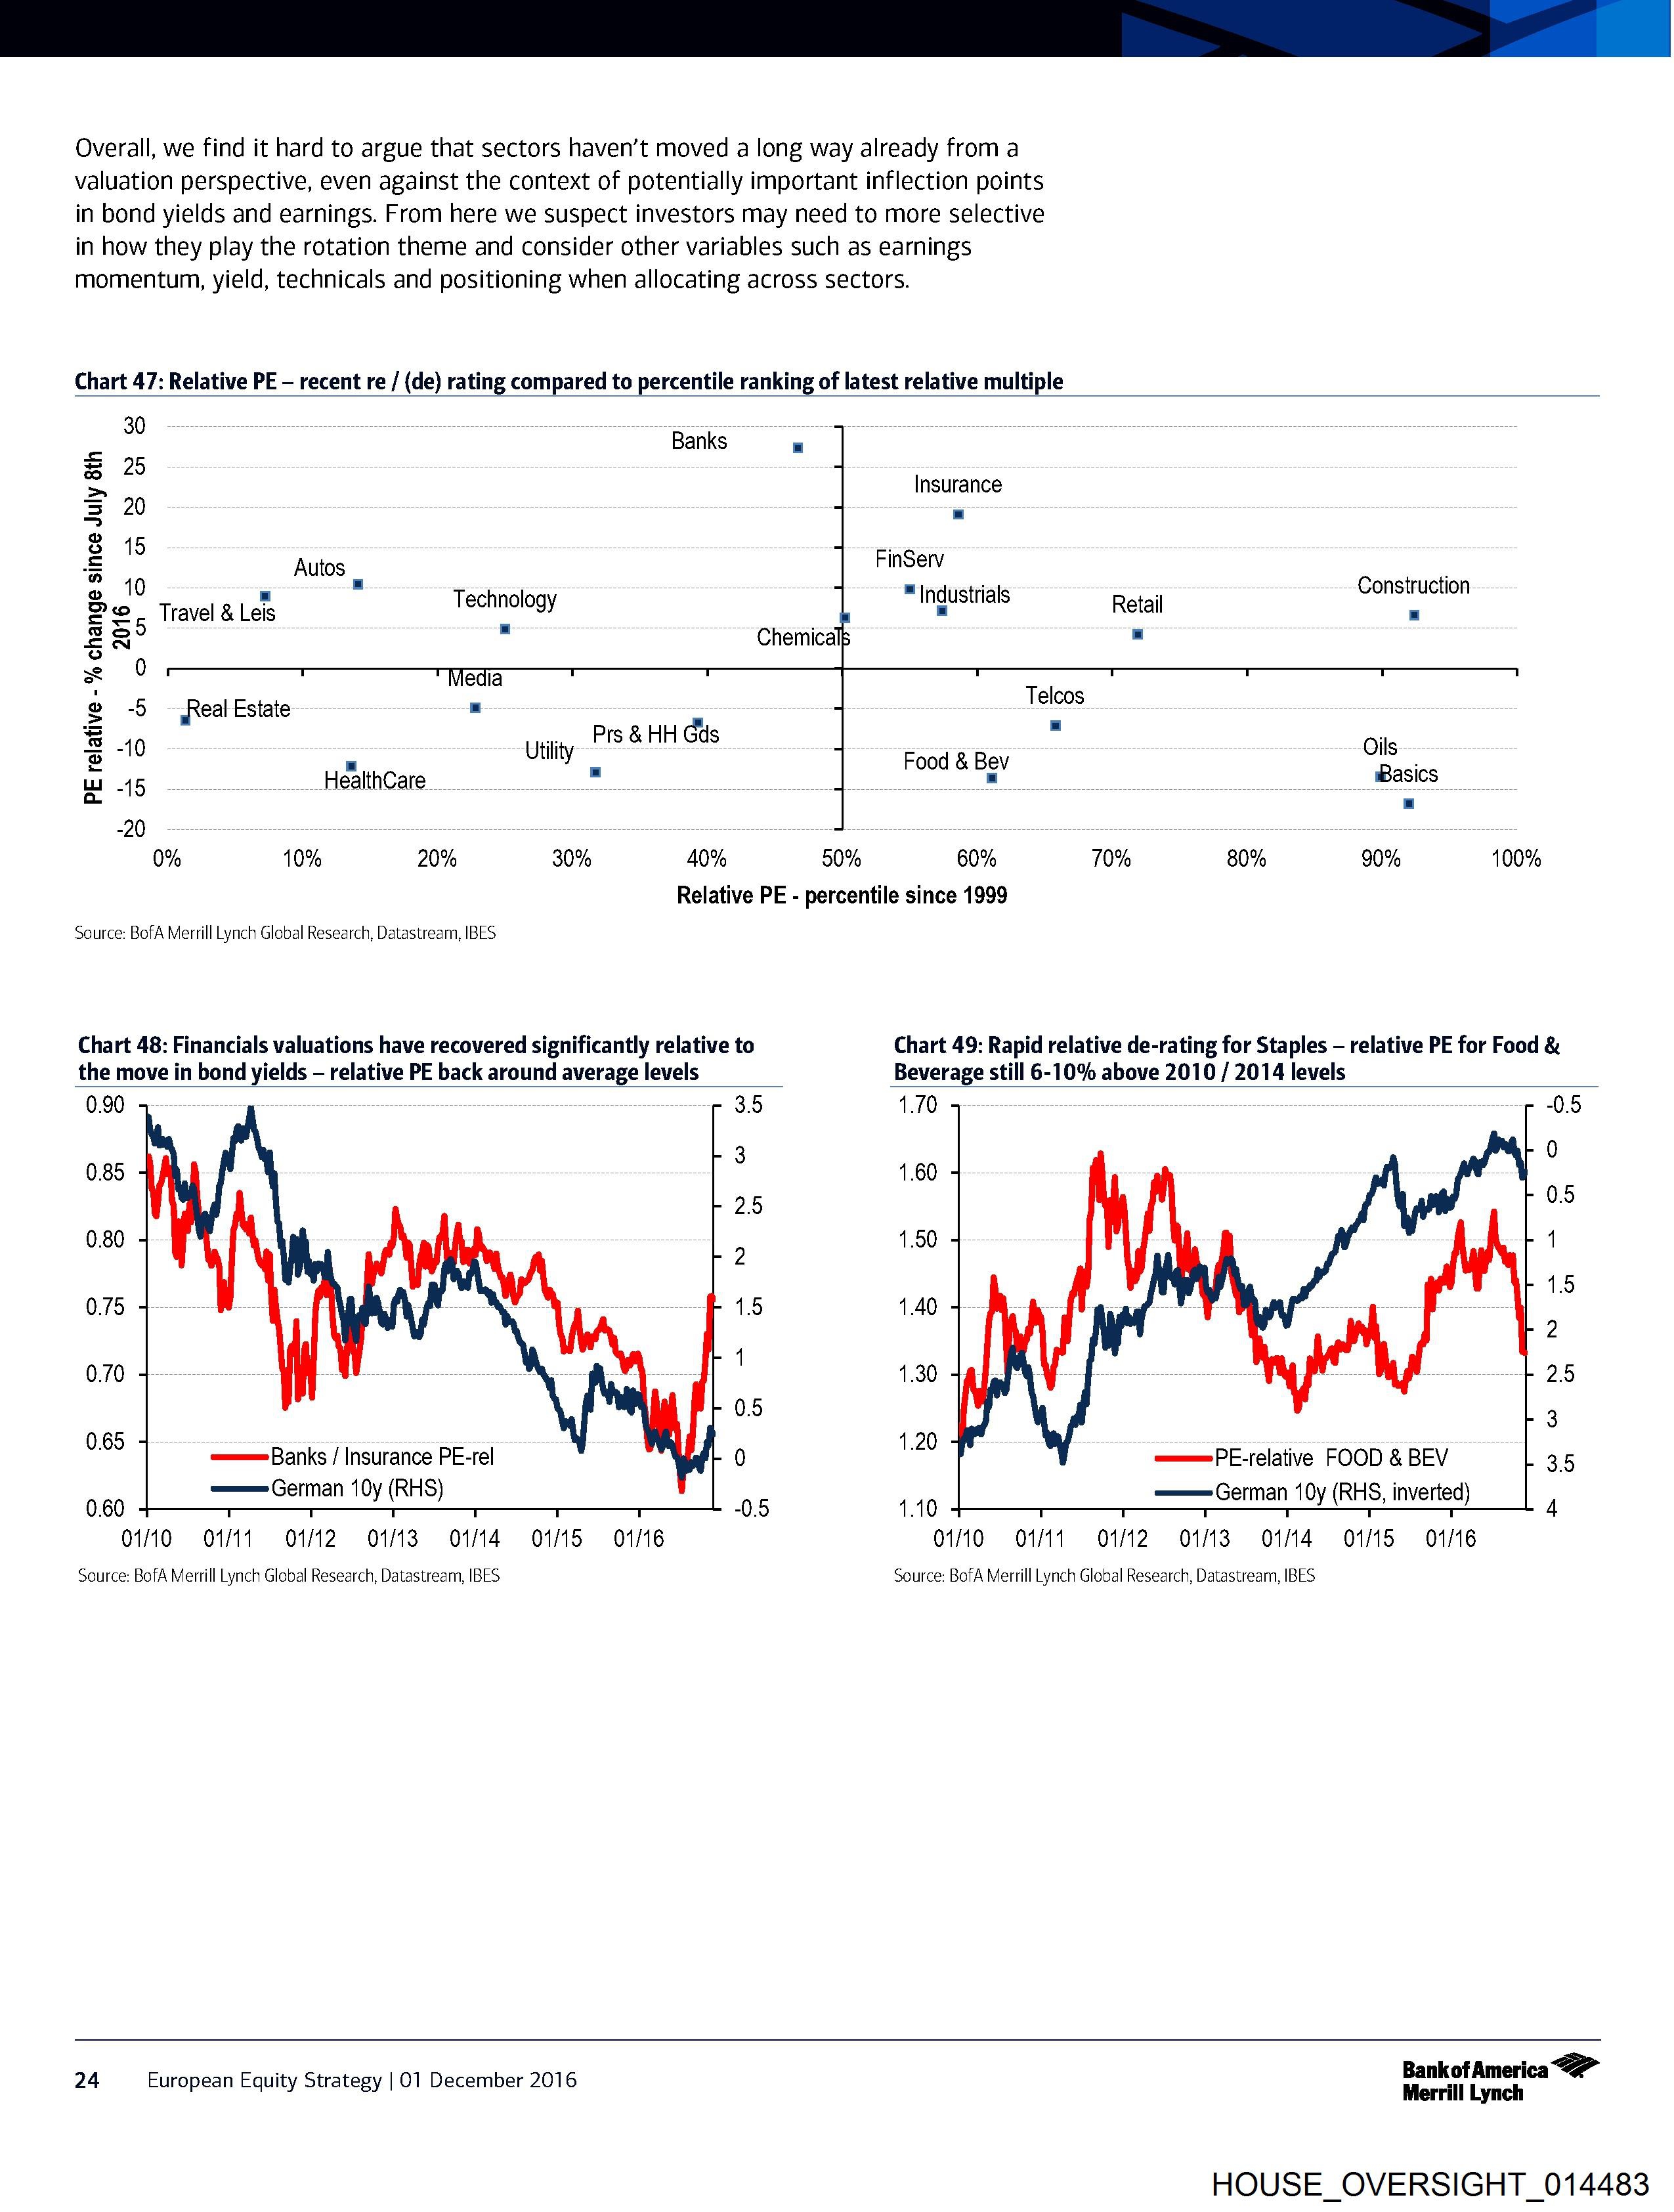
Overall, we find it hard to argue that sectors haven’t moved a long way already from a
valuation perspective, even against the context of potentially important inflection points
in bond yields and earnings. From here we suspect investors may need to more selective
in how they play the rotation theme and consider other variables such as earnings
momentum, yield, technicals and positioning when allocating across sectors.
Chart 47: Relative PE - recent re / (de) rating compared to percentile ranking of latest relative multiple
30
Banks :
=
se 25
> Insurance
Bs 20 ‘Z
S
o
2 18 Autos FinServ
° 40 Sindusttiats : Construction
> © Travel & Leis Technology : Retail :
@ 50 = :
S N
xs «0
: Telcos
g 5 ~jReal Estate -
® 40 - utility PS 8 HH Gds sod & Bes Oils
Wi 45 HealthCare = " Basics
o. 7
-20
0% 10% 20% 30% 40% 50% 60% 70% 80% 90% 100%
Relative PE - percentile since 1999
Source: BofA Merrill Lynch Global Research, Datastream, IBES
Chart 48: Financials valuations have recovered significantly relative to Chart 49: Rapid relative de-rating for Staples — relative PE for Food &
the move in bond yields — relative PE back around average levels Beverage still 6-10% above 2010 / 2014 levels
0.90 3.5 1.70 0.5
0
0.85 3 1.60
0.80 1.50 1
2
1.5
0.75 1.5 1.40
2
0.70 ' 1.30 2.5
0.65 » 1.20 °
, === Banks / Insurance PE-rel 0 , =——=PE-relative FOOD & BEV 35
=== German 10y (RHS — i
eee y (RHS) ae “5 German 10y (RHS, inverted) P
01/10 «01/11 012) 013 014 =—01/15 (01/16 01/10 «01/11 «012-013 014) =01/15 (01/16
Source: BofA Merrill Lynch Global Research, Datastream, IBES Source: BofA Merrill Lynch Global Research, Datastream, IBES
Bankot America
24 European Equity Strategy | 01 December 2016 Merrill Lynch
HOUSE_OVERSIGHT_014483
Document Preview

Click to view full size
Document Details
| Filename | HOUSE_OVERSIGHT_014483.jpg |
| File Size | 0.0 KB |
| OCR Confidence | 85.0% |
| Has Readable Text | Yes |
| Text Length | 1,729 characters |
| Indexed | 2026-02-04T15:25:47.532148 |