HOUSE_OVERSIGHT_014480.jpg
Extracted Text (OCR)
below $40. In other words, the outcome is highly binary in the short term for crude and
related equities. We flag to investors that we would consider reducing our weighting in
the event of no deal.
Assuming OPEC does cut production and oil prices recover up to the high $50s per
barrel, as per our commodity strategists views, earnings and cash flows can recover
significantly in the coming 12-18 months. Our Oil analysts model between 8 and 17%
upside to operating cash flows in 2017 for European integrated stocks if assumed crude
prices are increased $10 from $50 to $60. That makes the highest DY in market at ~6%
more sustainable out of FCF coverage.
Cautious UK domestic (underweight Retail, Travel & Leisure). We are cautious on
domestic UK exposure and underweight Retail and Travel & Leisure. To our mind, these
companies face a lose-lose trade-off of maintaining margins by passing on higher costs
at the expense of volumes, or face margin pressure by absorbing these costs in order to
sustain current volumes. Building inflationary pressures point to a post-Christmas
consumer squeeze. This could be further compounded OPEC cuts and oil prices rise. The
Retail sector is also facing structural margin pressures and unattractive valuations. In
Travel & Leisure (two thirds UK listed), profitability is declining from peak levels. Note
our analysts also see structural pressures on airlines from overcapacity and competition.
See below for more details.
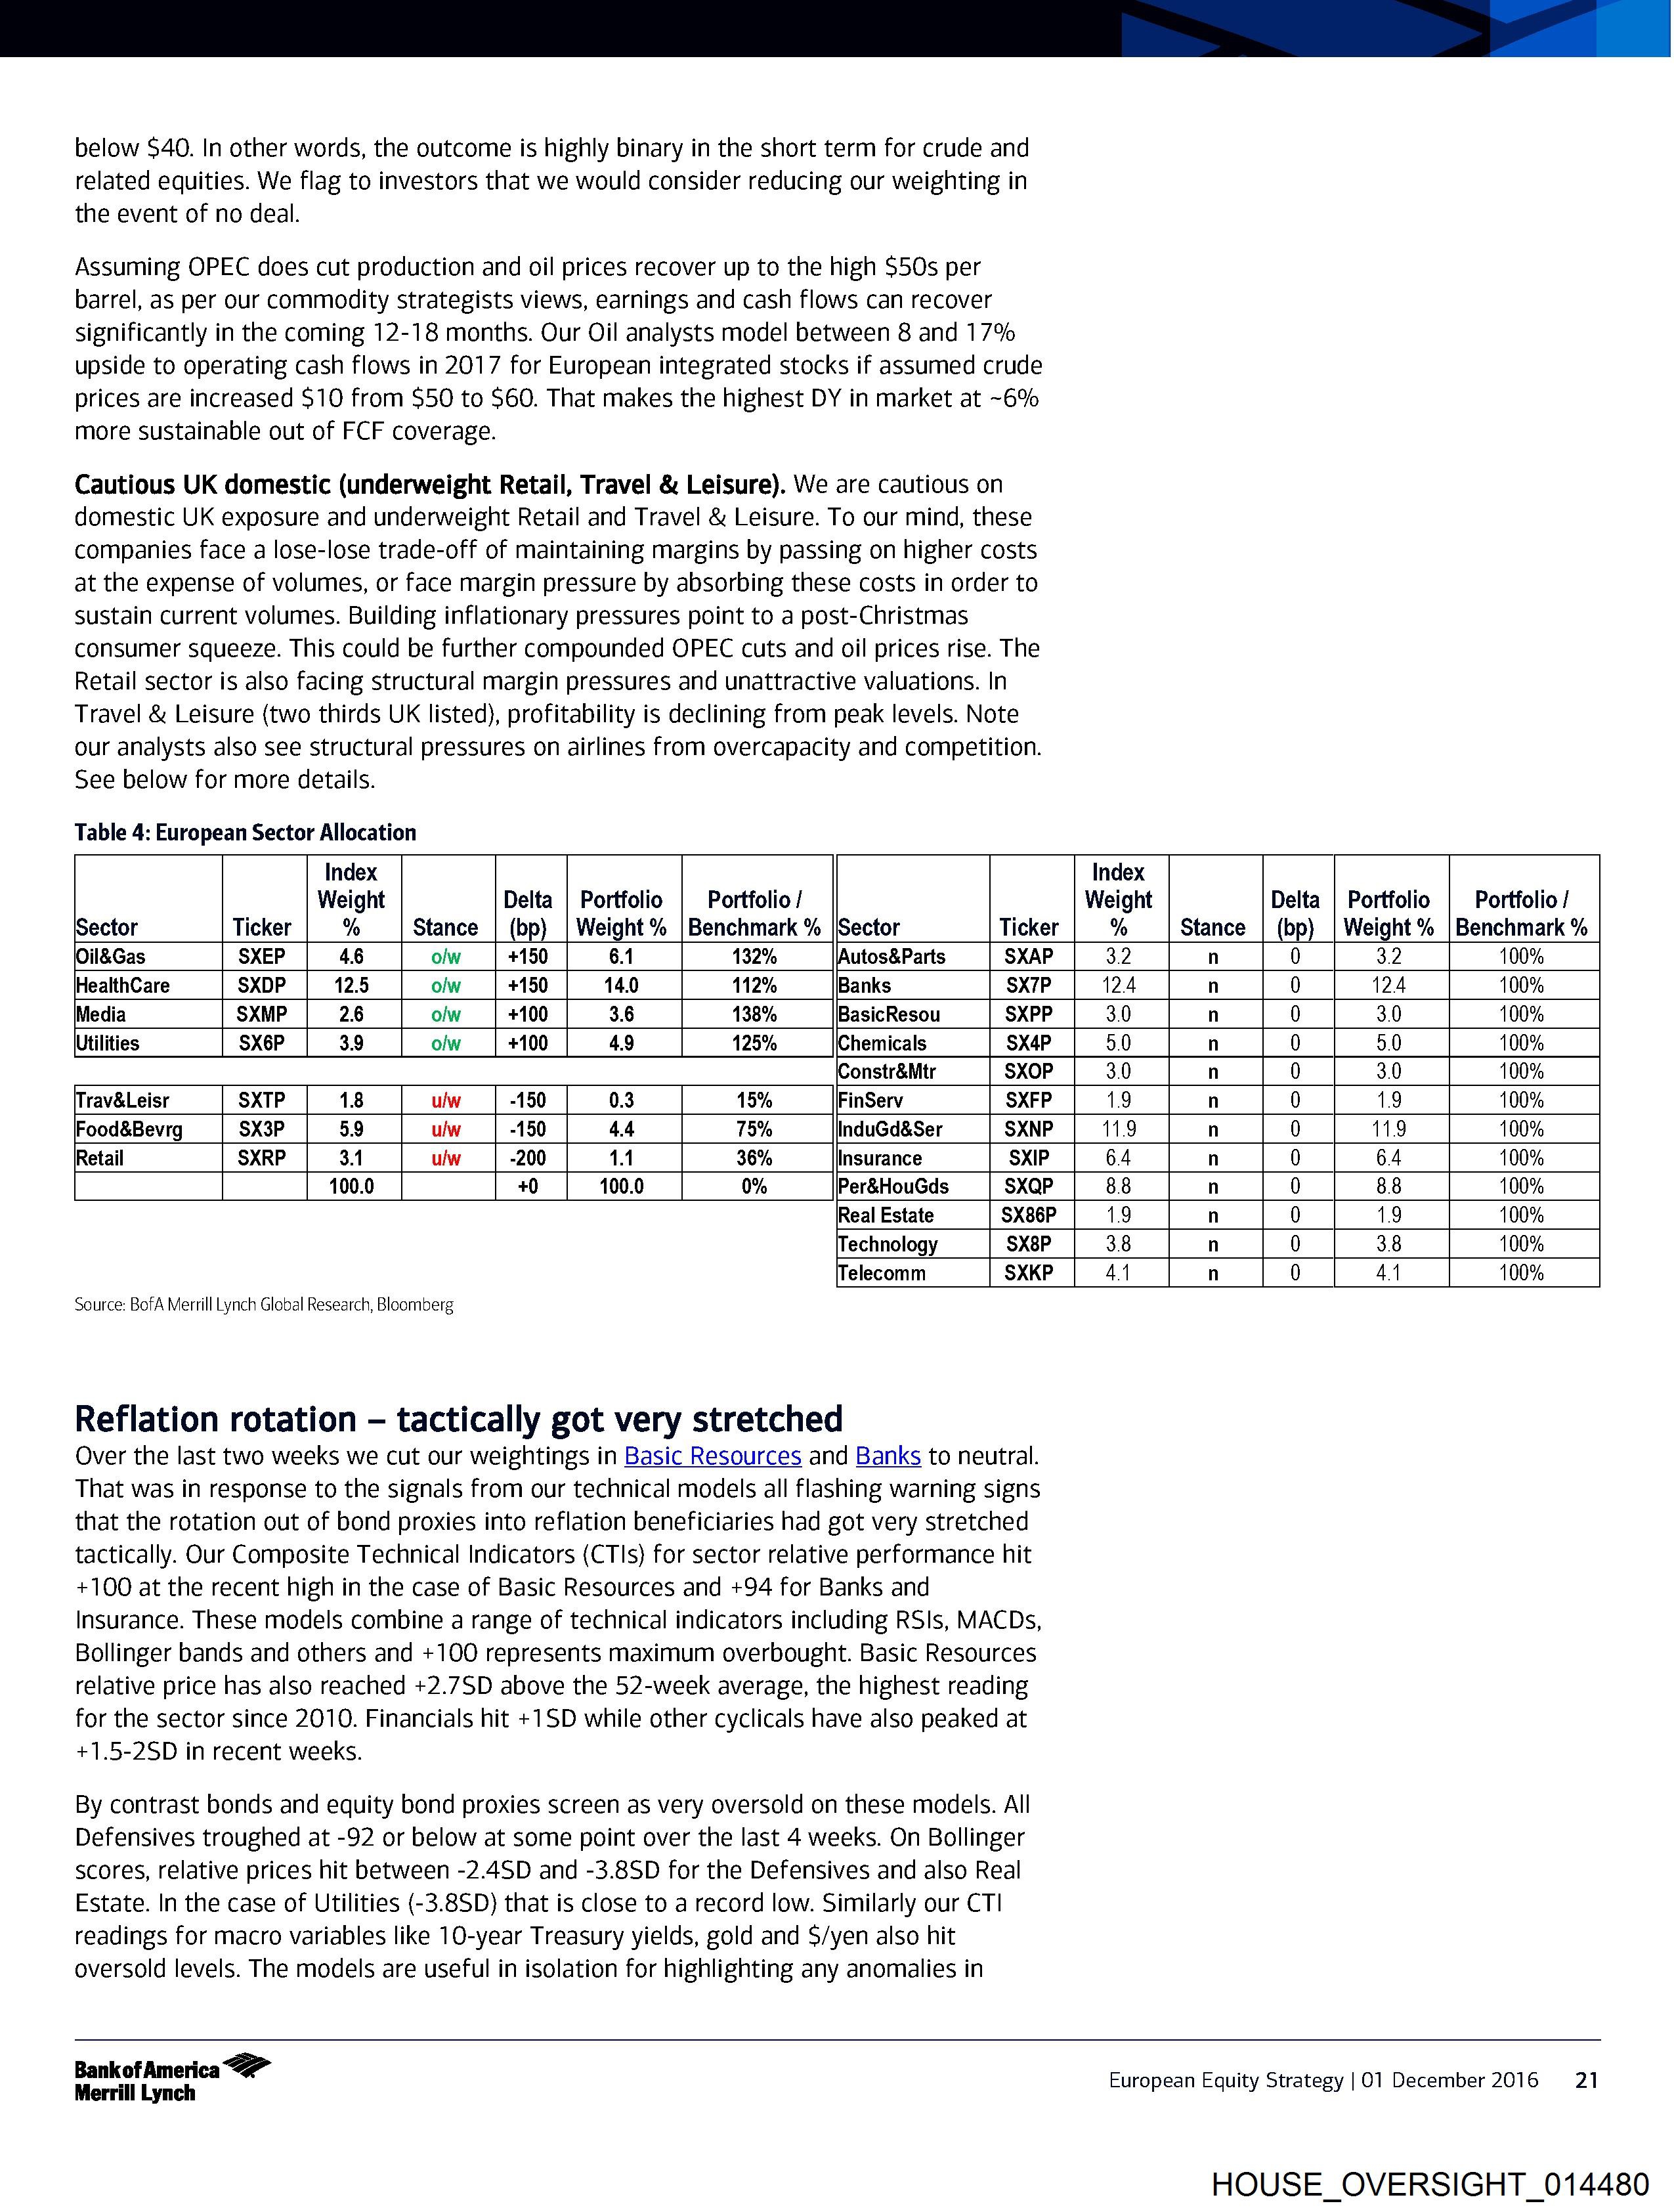
Table 4: European Sector Allocation
Index Index
Weight Delta | Portfolio | Portfolio / Weight Delta | Portfolio | Portfolio /
Sector Ticker % Stance | (bp) | Weight % |Benchmark % |Sector Ticker % Stance | (bp) | Weight % |Benchmark %
(Oi1&Gas SXEP 46 olw +150 6.1 132% |Autos&Parts SXAP 3.2 n 0 3.2 00%
HealthCare SXDP 12.5 olw +150 14.0 112% Banks SX7P 12.4 n 0 124 00%
Media SXMP 26 olw +100 3.6 138% BasicResou SXPP 3.0 n 0 3.0 00%
Utilities SX6P 3.9 olw +100 4.9 125% Chemicals SX4P 5.0 n 0 5.0 00%
Constr&Mtr SXOP 3.0 n 0 3.0 00%
Trav&Leisr SXTP 1.8 ulw -150 0.3 15% FinServ SXFP 1.9 n 0 1.9 00%
Food&Bevrg SX3P 59 u/w -150 4.4 75% InduGd&Ser SXNP 11.9 n 0 11.9 00%
Retail SXRP 3.1 ulw -200 1.1 36% Insurance SXIP 64 n 0 64 00%
100.0 +0 100.0 0% Per&HouGds SXQP 88 n 0 88 00%
Real Estate SX86P 1.9 n 0 1.9 00%
Technology SX8P 3.8 n 0 3.8 00%
Telecomm SXKP 44 n 0 44 00%
Source: BofA Merrill Lynch Global Research, Bloomberg
Reflation rotation — tactically got very stretched
Over the last two weeks we cut our weightings in Basic Resources and Banks to neutral.
That was in response to the signals from our technical models all flashing warning signs
that the rotation out of bond proxies into reflation beneficiaries had got very stretched
tactically. Our Composite Technical Indicators (CTls) for sector relative performance hit
+100 at the recent high in the case of Basic Resources and +94 for Banks and
Insurance. These models combine a range of technical indicators including RSIs, MACDs,
Bollinger bands and others and +100 represents maximum overbought. Basic Resources
relative price has also reached +2.7SD above the 52-week average, the highest reading
for the sector since 2010. Financials hit +1SD while other cyclicals have also peaked at
+1.5-2SD in recent weeks.
By contrast bonds and equity bond proxies screen as very oversold on these models. All
Defensives troughed at -92 or below at some point over the last 4 weeks. On Bollinger
scores, relative prices hit between -2.4SD and -3.8SD for the Defensives and also Real
Estate. In the case of Utilities (-3.8SD) that is close to a record low. Similarly our CTI
readings for macro variables like 10-year Treasury yields, gold and S/yen also hit
oversold levels. The models are useful in isolation for highlighting any anomalies in
Bankof America
Merrill Lynch European Equity Strategy |01 December 2016 21
HOUSE_OVERSIGHT_014480
Document Preview

Click to view full size
Document Details
| Filename | HOUSE_OVERSIGHT_014480.jpg |
| File Size | 0.0 KB |
| OCR Confidence | 85.0% |
| Has Readable Text | Yes |
| Text Length | 3,877 characters |
| Indexed | 2026-02-04T15:25:48.879025 |