HOUSE_OVERSIGHT_014462.jpg
Extracted Text (OCR)
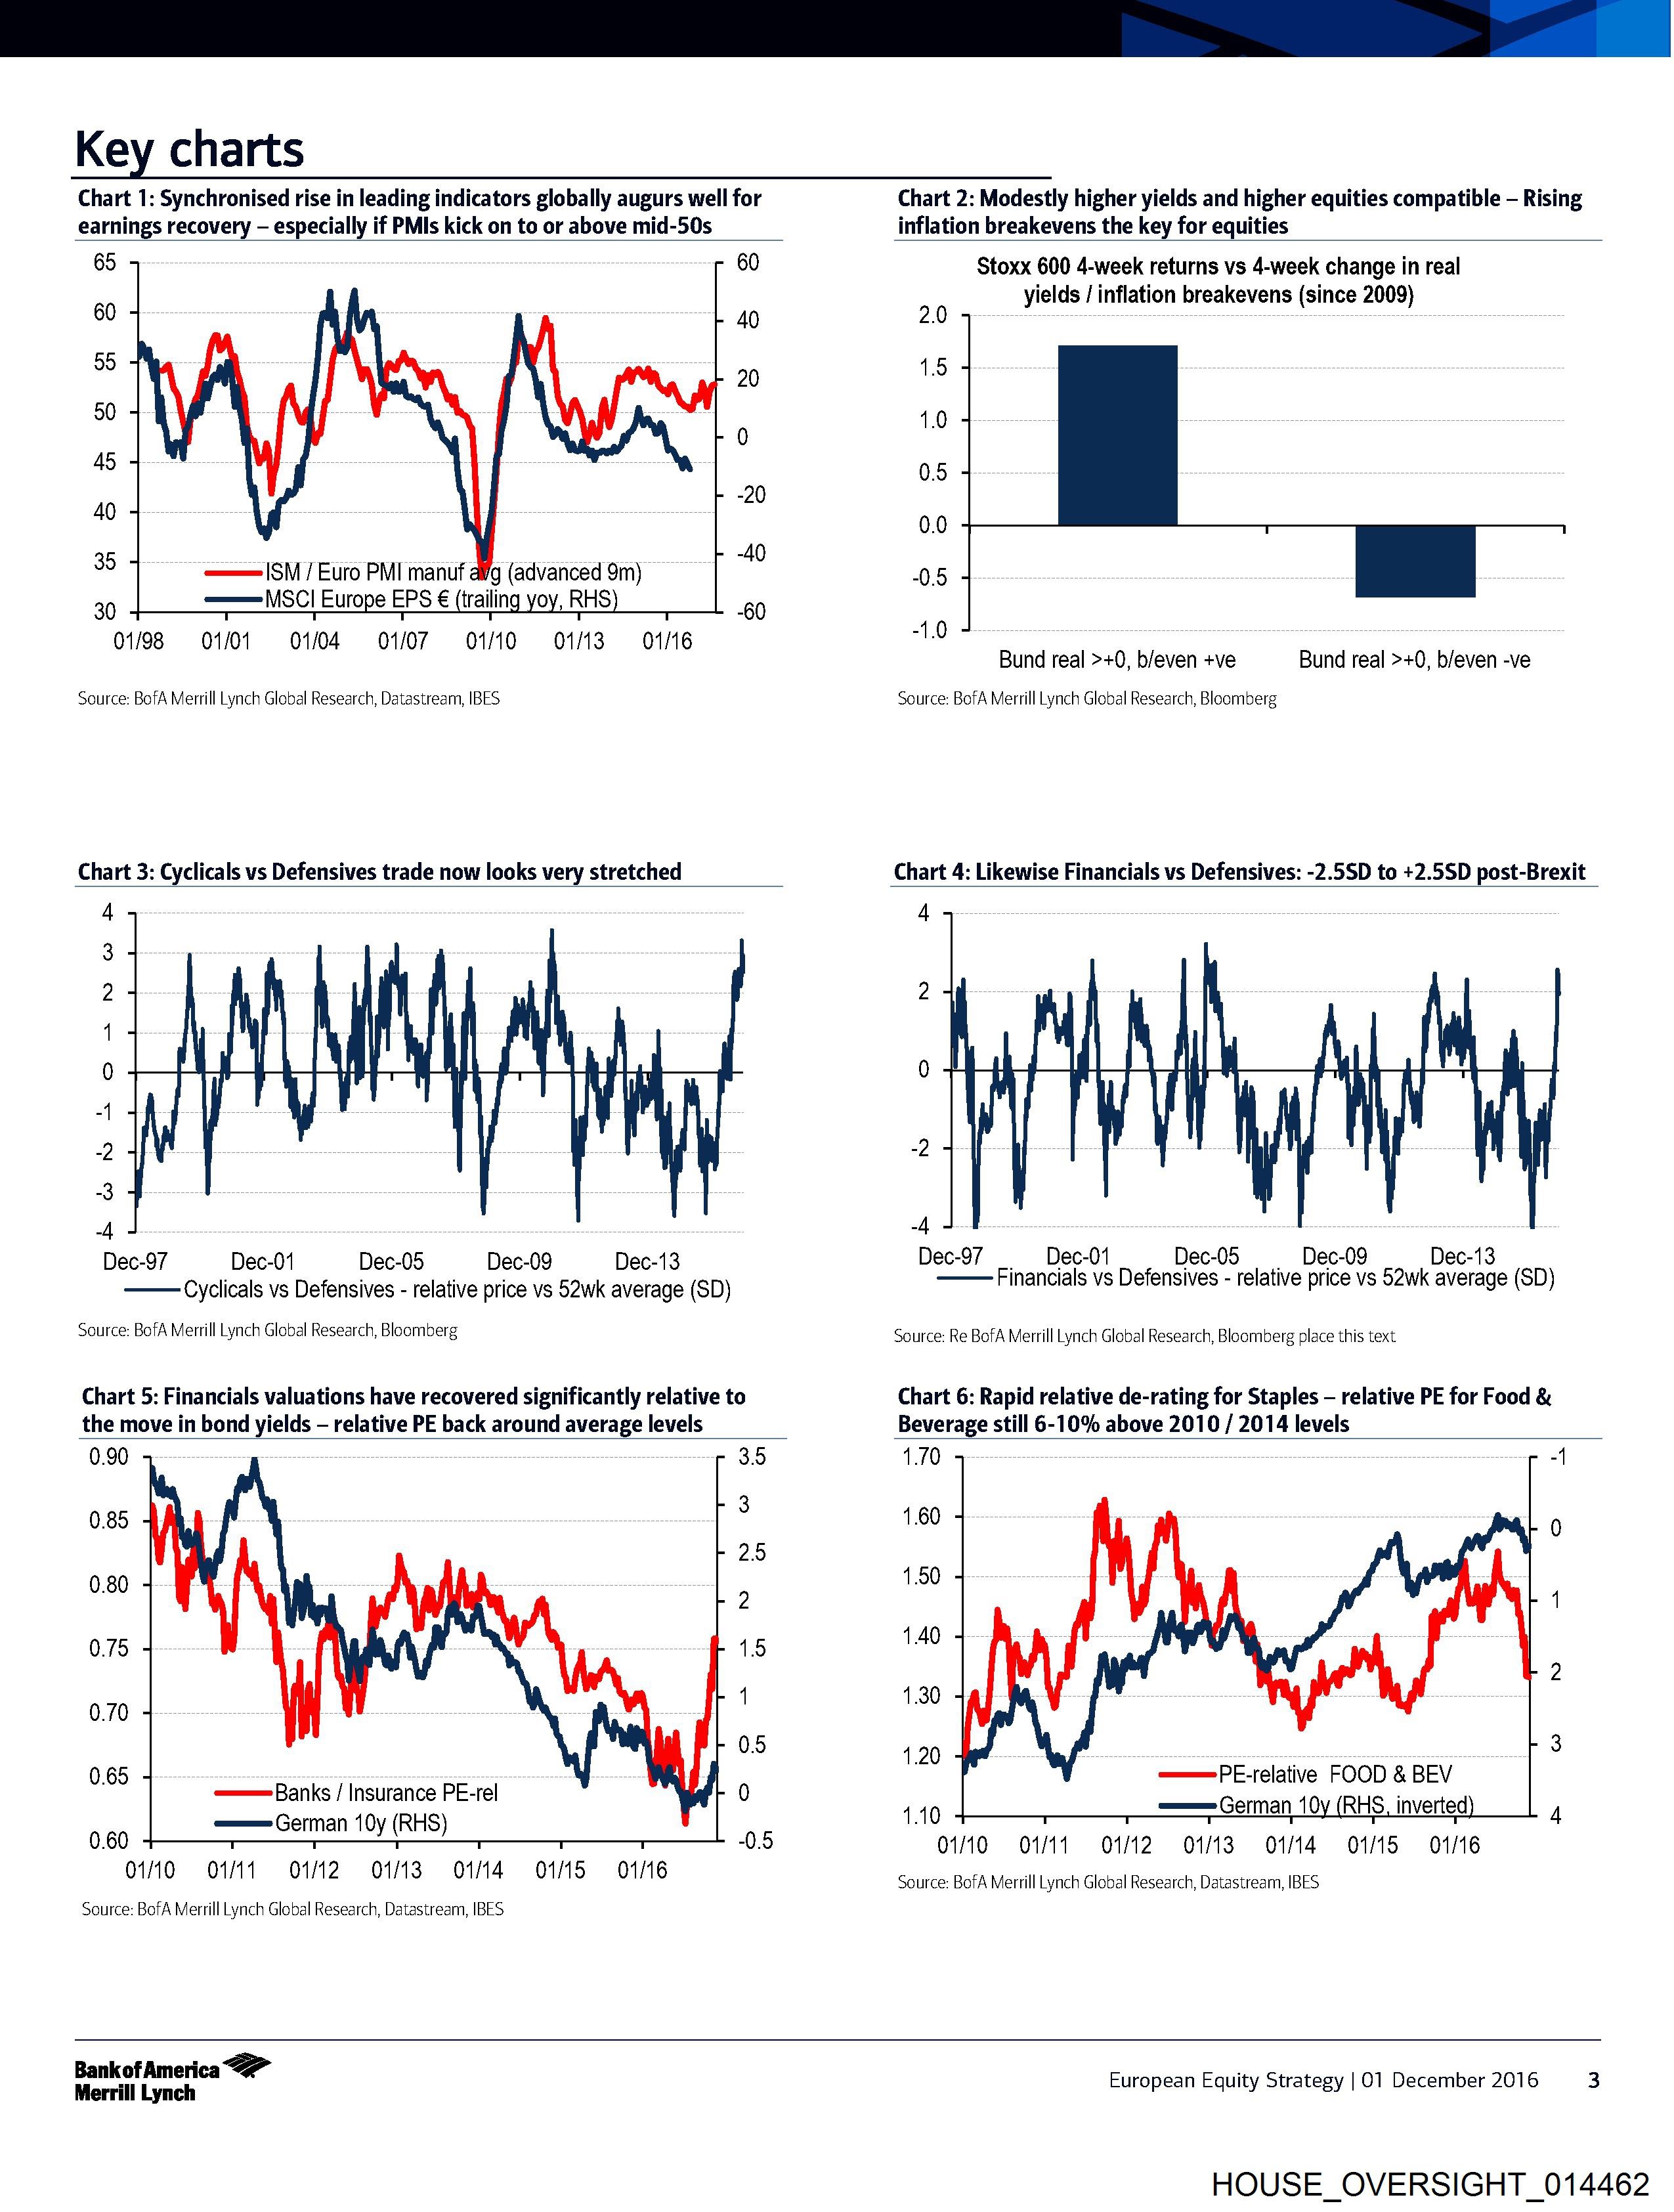
Key charts
Chart 1: Synchronised rise in leading indicators globally augurs well for
earnings recovery — especially if PMIs kick on to or above mid-50s
65 60
60 40
55 20
50
0
45
40 “20
35 ; 40
—— ($M / Euro PMI manuf alg (advanced 9m)
30 == |\iSCI Europe EPS € (trailing yoy, R 60
01/98 «= 01/01 0104 01/07 O10 O13 O16
Source: BofA Merrill Lynch Global Research, Datastream, IBES
Chart 3: Cyclicals vs Defensives trade now looks very stretched
4
3
2
1
0
|
-2
3
-4
Dec-97 Dec-01 Dec-05 Dec-09 Dec-13
Cyclicals vs Defensives - relative price vs 52wk average (SD)
Source: BofA Merrill Lynch Global Research, Bloomberg
Chart 5: Financials valuations have recovered significantly relative to
the move in bond yields — relative PE back around average levels
0.90 3.5
0.85 y 3
25
0.80 9
0.75 15
0.70 i
0.5
0.65 ——— Banks / Insurance PE-rel 0
0.60 == German 10y (RHS) 05
O1N0 =O1f1 O12 01/13 0104 O15 801/16
Source: BofA Merrill Lynch Global Research, Datastream, IBES
Chart 2: Modestly higher yields and higher equities compatible — Rising
inflation breakevens the key for equities
Stoxx 600 4-week returns vs 4-week change in real
an yields / inflation breakevens (since 2009)
1.5
1.0
0.5
0.0
0.5
-1.0
Bund real >+0, b/even +ve Bund real >+0, b/even -ve
Source: BofA Merrill Lynch Global Research, Bloomberg
Chart 4: Likewise Financials vs Defensives: -2.5SD to +2.5SD post-Brexit
4
4
Dec-97 _ _Dec-01 Dec-05 —_—— Dec-09 Dec-13
Financials vs Defensives - relative price vs 52wk average (SD)
Source: Re BofA Merrill Lynch Global Research, Bloomberg place this text
Chart 6: Rapid relative de-rating for Staples — relative PE for Food &
Beverage still 6-10% above 2010 / 2014 levels
1.70
1.60
1.50
1.40
1.30
1.20
———PE-relative FOOD & BEV
110 eee German 10y (RHS, inverted
01/10 = O1/11 =O1N2 «013 «01/14 =(01/15 (01/16
Source: BofA Merrill Lynch Global Research, Datastream, IBES
Bankof America
Merrill Lynch
European Equity Strategy | O01 December 2016 3
HOUSE_OVERSIGHT_014462
Document Preview

Click to view full size
Document Details
| Filename | HOUSE_OVERSIGHT_014462.jpg |
| File Size | 0.0 KB |
| OCR Confidence | 85.0% |
| Has Readable Text | Yes |
| Text Length | 2,013 characters |
| Indexed | 2026-02-04T16:22:34.216433 |