HOUSE_OVERSIGHT_014468.jpg
Extracted Text (OCR)
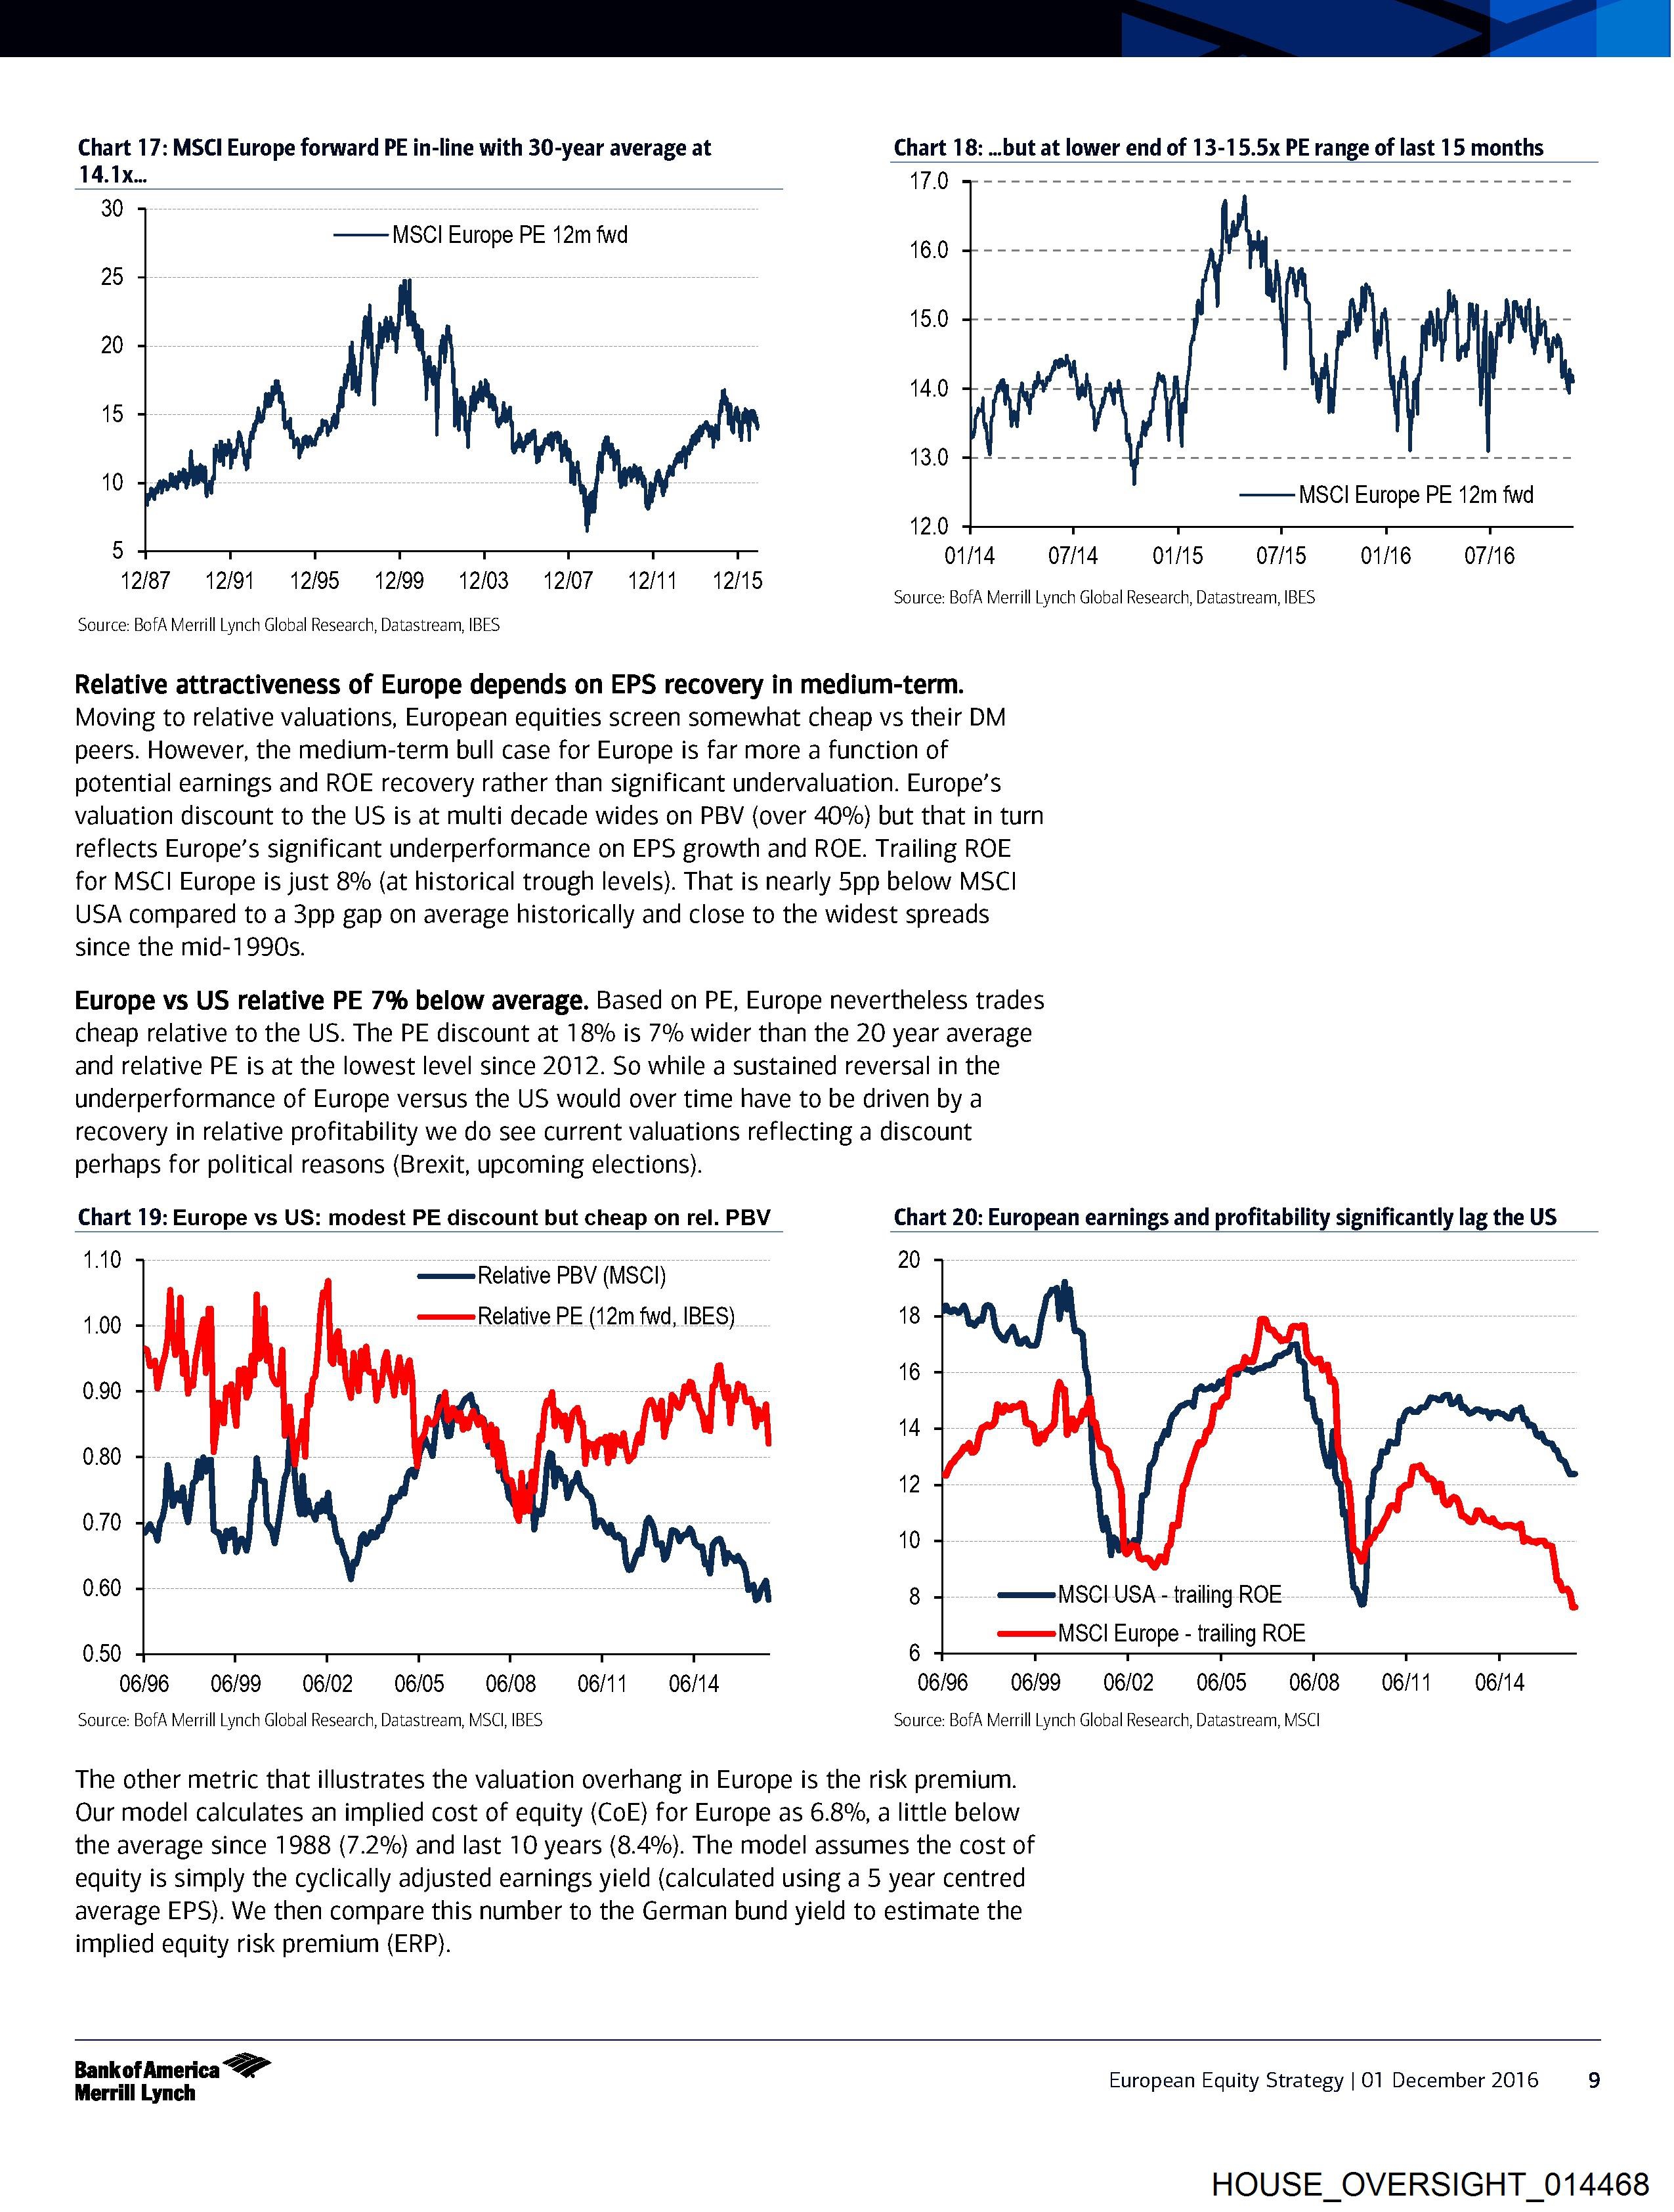
Chart 17: MSCI Europe forward PE in-line with 30-year average at
Chart 18: ...but at lower end of 13-15.5x PE range of last 15 months
14.1x... 17.0
30
——MSClI Europe PE 12m fwd 16.0
25
15.0
20
14.0
15
13.0
10 —MSCl Europe PE 12m fwd
12.0
) O14 = O74 OMS SCOTS SCOOT
12/87 12/91 12/95 9612/99 912/03 12/07 12/11 12/15 ;
Source: BofA Merrill Lynch Global Research, Datastream, IBES
Source: BofA Merrill Lynch Global Research, Datastream, IBES
Relative attractiveness of Europe depends on EPS recovery in medium-term.
Moving to relative valuations, European equities screen somewhat cheap vs their DM
peers. However, the medium-term bull case for Europe is far more a function of
potential earnings and ROE recovery rather than significant undervaluation. Europe’s
valuation discount to the US is at multi decade wides on PBV (over 40%) but that in turn
reflects Europe’s significant underperformance on EPS growth and ROE. Trailing ROE
for MSCI Europe is just 8% (at historical trough levels). That is nearly 5pp below MSCI
USA compared to a 3pp gap on average historically and close to the widest spreads
since the mid-1990s.
Europe vs US relative PE 7% below average. Based on PE, Europe nevertheless trades
cheap relative to the US. The PE discount at 18% is 7% wider than the 20 year average
and relative PE is at the lowest level since 2012. So while a sustained reversal in the
underperformance of Europe versus the US would over time have to be driven by a
recovery in relative profitability we do see current valuations reflecting a discount
perhaps for political reasons (Brexit, upcoming elections).
Chart 19: Europe vs US: modest PE discount but cheap on rel. PBV
1.10
Chart 20: European earnings and profitability significantly lag the US
——Relative PBV (MSCl)
——Relative PE (12m fwd, IBES)
1.00
0.90
0.80
0.70
0.60
=——=MSCI USA - trailing ROE
=———=|MSCI Europe - trailing ROE
0.50
06/6 = 06/99.——«<OG/O2—s«OG/OS.s«OG/OS = (OG/11 (06/14 06/96 «= 06/99—sC«OG/O2—sCOGNS—isi«G/OSCG 11 S(O 14
Source: BofA Merrill Lynch Global Research, Datastream, MSCI, IBES Source: BofA Merrill Lynch Global Research, Datastream, MSCI
The other metric that illustrates the valuation overhang in Europe is the risk premium.
Our model calculates an implied cost of equity (CoE) for Europe as 6.8%, a little below
the average since 1988 (7.2%) and last 10 years (8.4%). The model assumes the cost of
equity is simply the cyclically adjusted earnings yield (calculated using a 5 year centred
average EPS). We then compare this number to the German bund yield to estimate the
implied equity risk premium (ERP).
Bankof America
Merrill Lynch European Equity Strategy | O01 December 2016 9
HOUSE_OVERSIGHT_014468
Document Preview

Click to view full size
Document Details
| Filename | HOUSE_OVERSIGHT_014468.jpg |
| File Size | 0.0 KB |
| OCR Confidence | 85.0% |
| Has Readable Text | Yes |
| Text Length | 2,718 characters |
| Indexed | 2026-02-04T16:22:36.696197 |