HOUSE_OVERSIGHT_014471.jpg
Extracted Text (OCR)
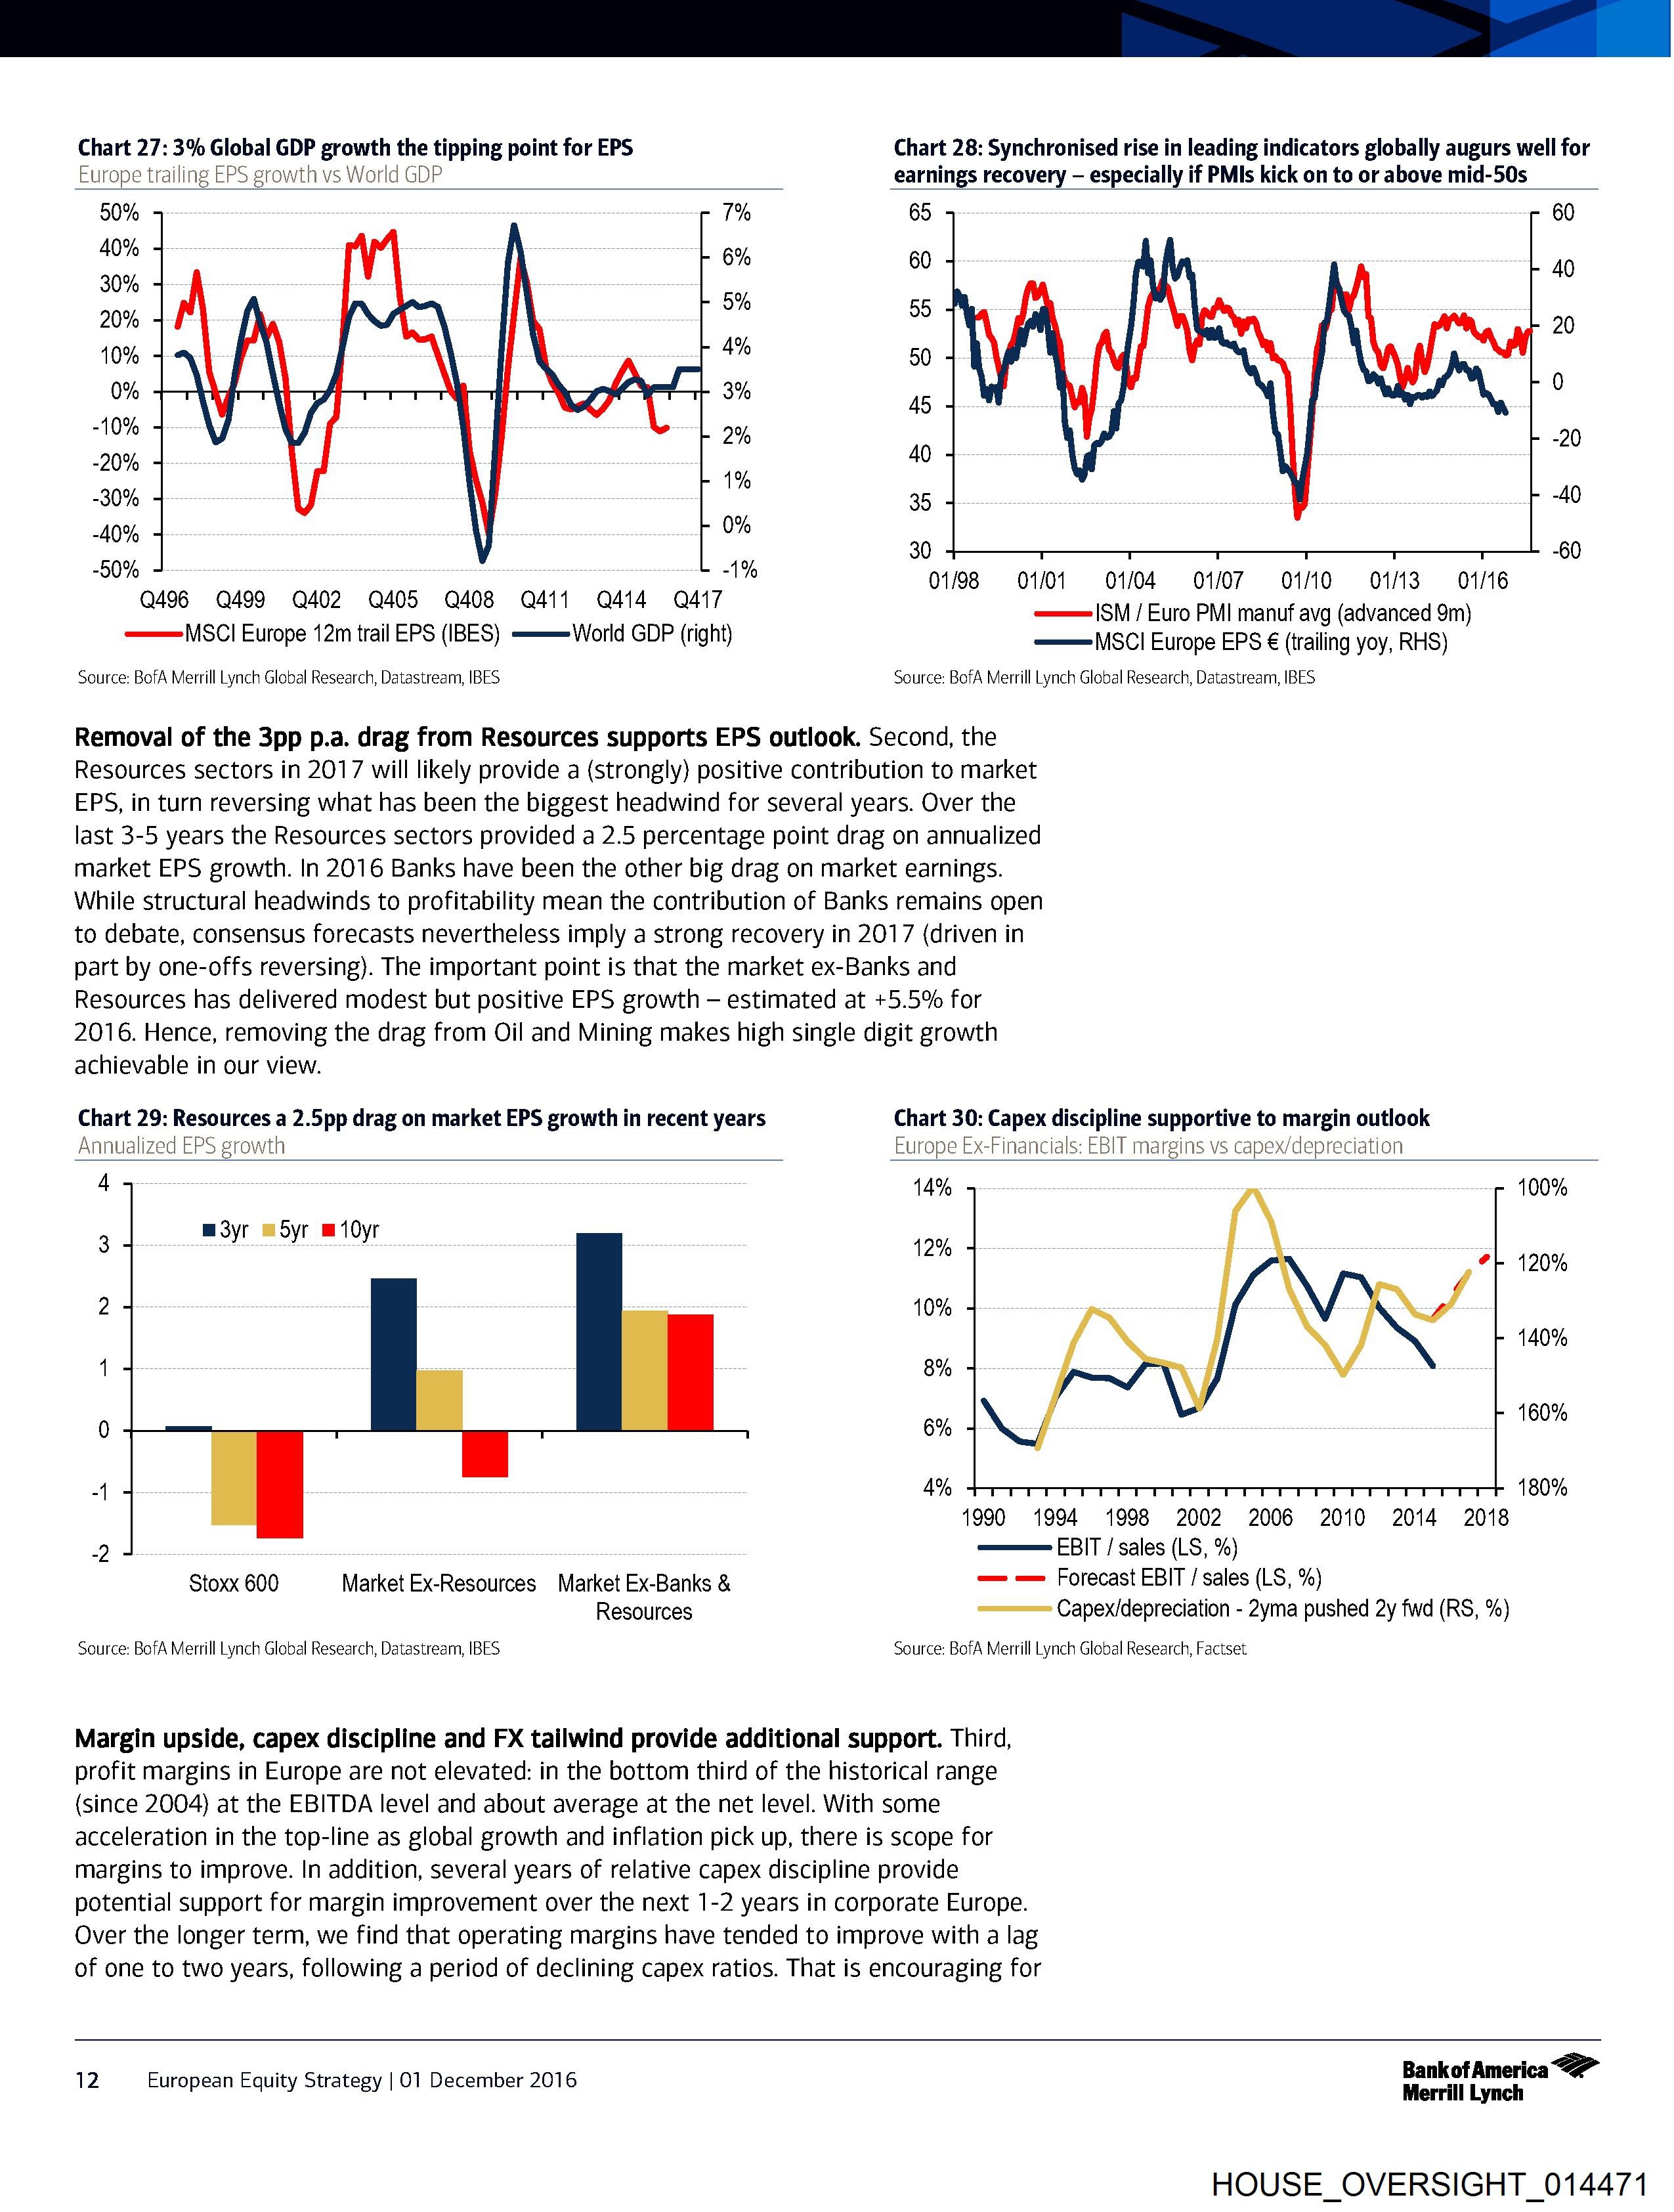
Chart 27: 3% Global GDP growth the tipping point for EPS
Europe trailing EPS growth vs World GDP
Chart 28: Synchronised rise in leading indicators globally augurs well for
earnings recovery — especially if PMIs kick on to or above mid-50s
50%
40%
30%
20%
10%
0%
-10%
-20%
-30%
-40%
-50%
7%
6%
5%
4%
3%
2%
1%
0%
-1%
Q496 Q499 Q402 Q405 Q408 Q411 Q414 Q417
Source: BofA Merrill Lynch Global Research, Datastream, IBES
MSCI Europe 12m trail EPS (IBES) ——-World GDP (right)
65 60
60 40
55 20
50
0
45
40 “20
35 -40
30 -60
01/08 801/01 =01/04SON/07 O10) O13 01/16
———|SM / Euro PMI manuf avg (advanced 9m)
=———|MSCI Europe EPS € (trailing yoy, RHS)
Source: BofA Merrill Lynch Global Research, Datastream, IBES
Removal of the 3pp p.a. drag from Resources supports EPS outlook. Second, the
Resources sectors in 2017 will likely provide a (strongly) positive contribution to market
EPS, in turn reversing what has been the biggest headwind for several years. Over the
last 3-5 years the Resources sectors provided a 2.5 percentage point drag on annualized
market EPS growth. In 2016 Banks have been the other big drag on market earnings.
While structural headwinds to profitability mean the contribution of Banks remains open
to debate, consensus forecasts nevertheless imply a strong recovery in 2017 (driven in
part by one-offs reversing). The important point is that the market ex-Banks and
Resources has delivered modest but positive EPS growth — estimated at +5.5% for
2016. Hence, removing the drag from Oil and Mining makes high single digit growth
achievable in our view.
Chart 29: Resources a 2.5pp drag on market EPS growth in recent years
Annualized EPS growth
Chart 30: Capex discipline supportive to margin outlook
Europe Ex-Financials: EBIT margins vs capex/depreciation
moyr mSyr m 10yr
Stoxx 600
Resources
Source: BofA Merrill Lynch Global Research, Datastream, IBES
Market Ex-Resources Market Ex-Banks &
14% 100%
Q
12% eL 120%
10%
140%
8%
ANS
6% 60%
4% 180%
1990 1994 1998 2002 2006 2010 2014 2018
EBIT / sales (LS, %)
— — Forecast EBIT / sales (LS, %)
Capex/depreciation - 2yma pushed 2y fwd (RS, %)
Source: BofA Merrill Lynch Global Research, Factset
Margin upside, capex discipline and FX tailwind provide additional support. Third,
profit margins in Europe are not elevated: in the bottom third of the historical range
(since 2004) at the EBITDA level and about average at the net level. With some
acceleration in the top-line as global growth and inflation pick up, there is scope for
margins to improve. In addition, several years of relative capex discipline provide
potential support for margin improvement over the next 1-2 years in corporate Europe.
Over the longer term, we find that operating margins have tended to improve with a lag
of one to two years, following a period of declining capex ratios. That is encouraging for
12 European Equity Strategy | 01 December 2016
BankofAmerica <2”
Merrill Lynch
HOUSE_OVERSIGHT_014471
Document Preview

Click to view full size
Document Details
| Filename | HOUSE_OVERSIGHT_014471.jpg |
| File Size | 0.0 KB |
| OCR Confidence | 85.0% |
| Has Readable Text | Yes |
| Text Length | 2,977 characters |
| Indexed | 2026-02-04T16:22:37.258612 |