HOUSE_OVERSIGHT_014473.jpg
Extracted Text (OCR)
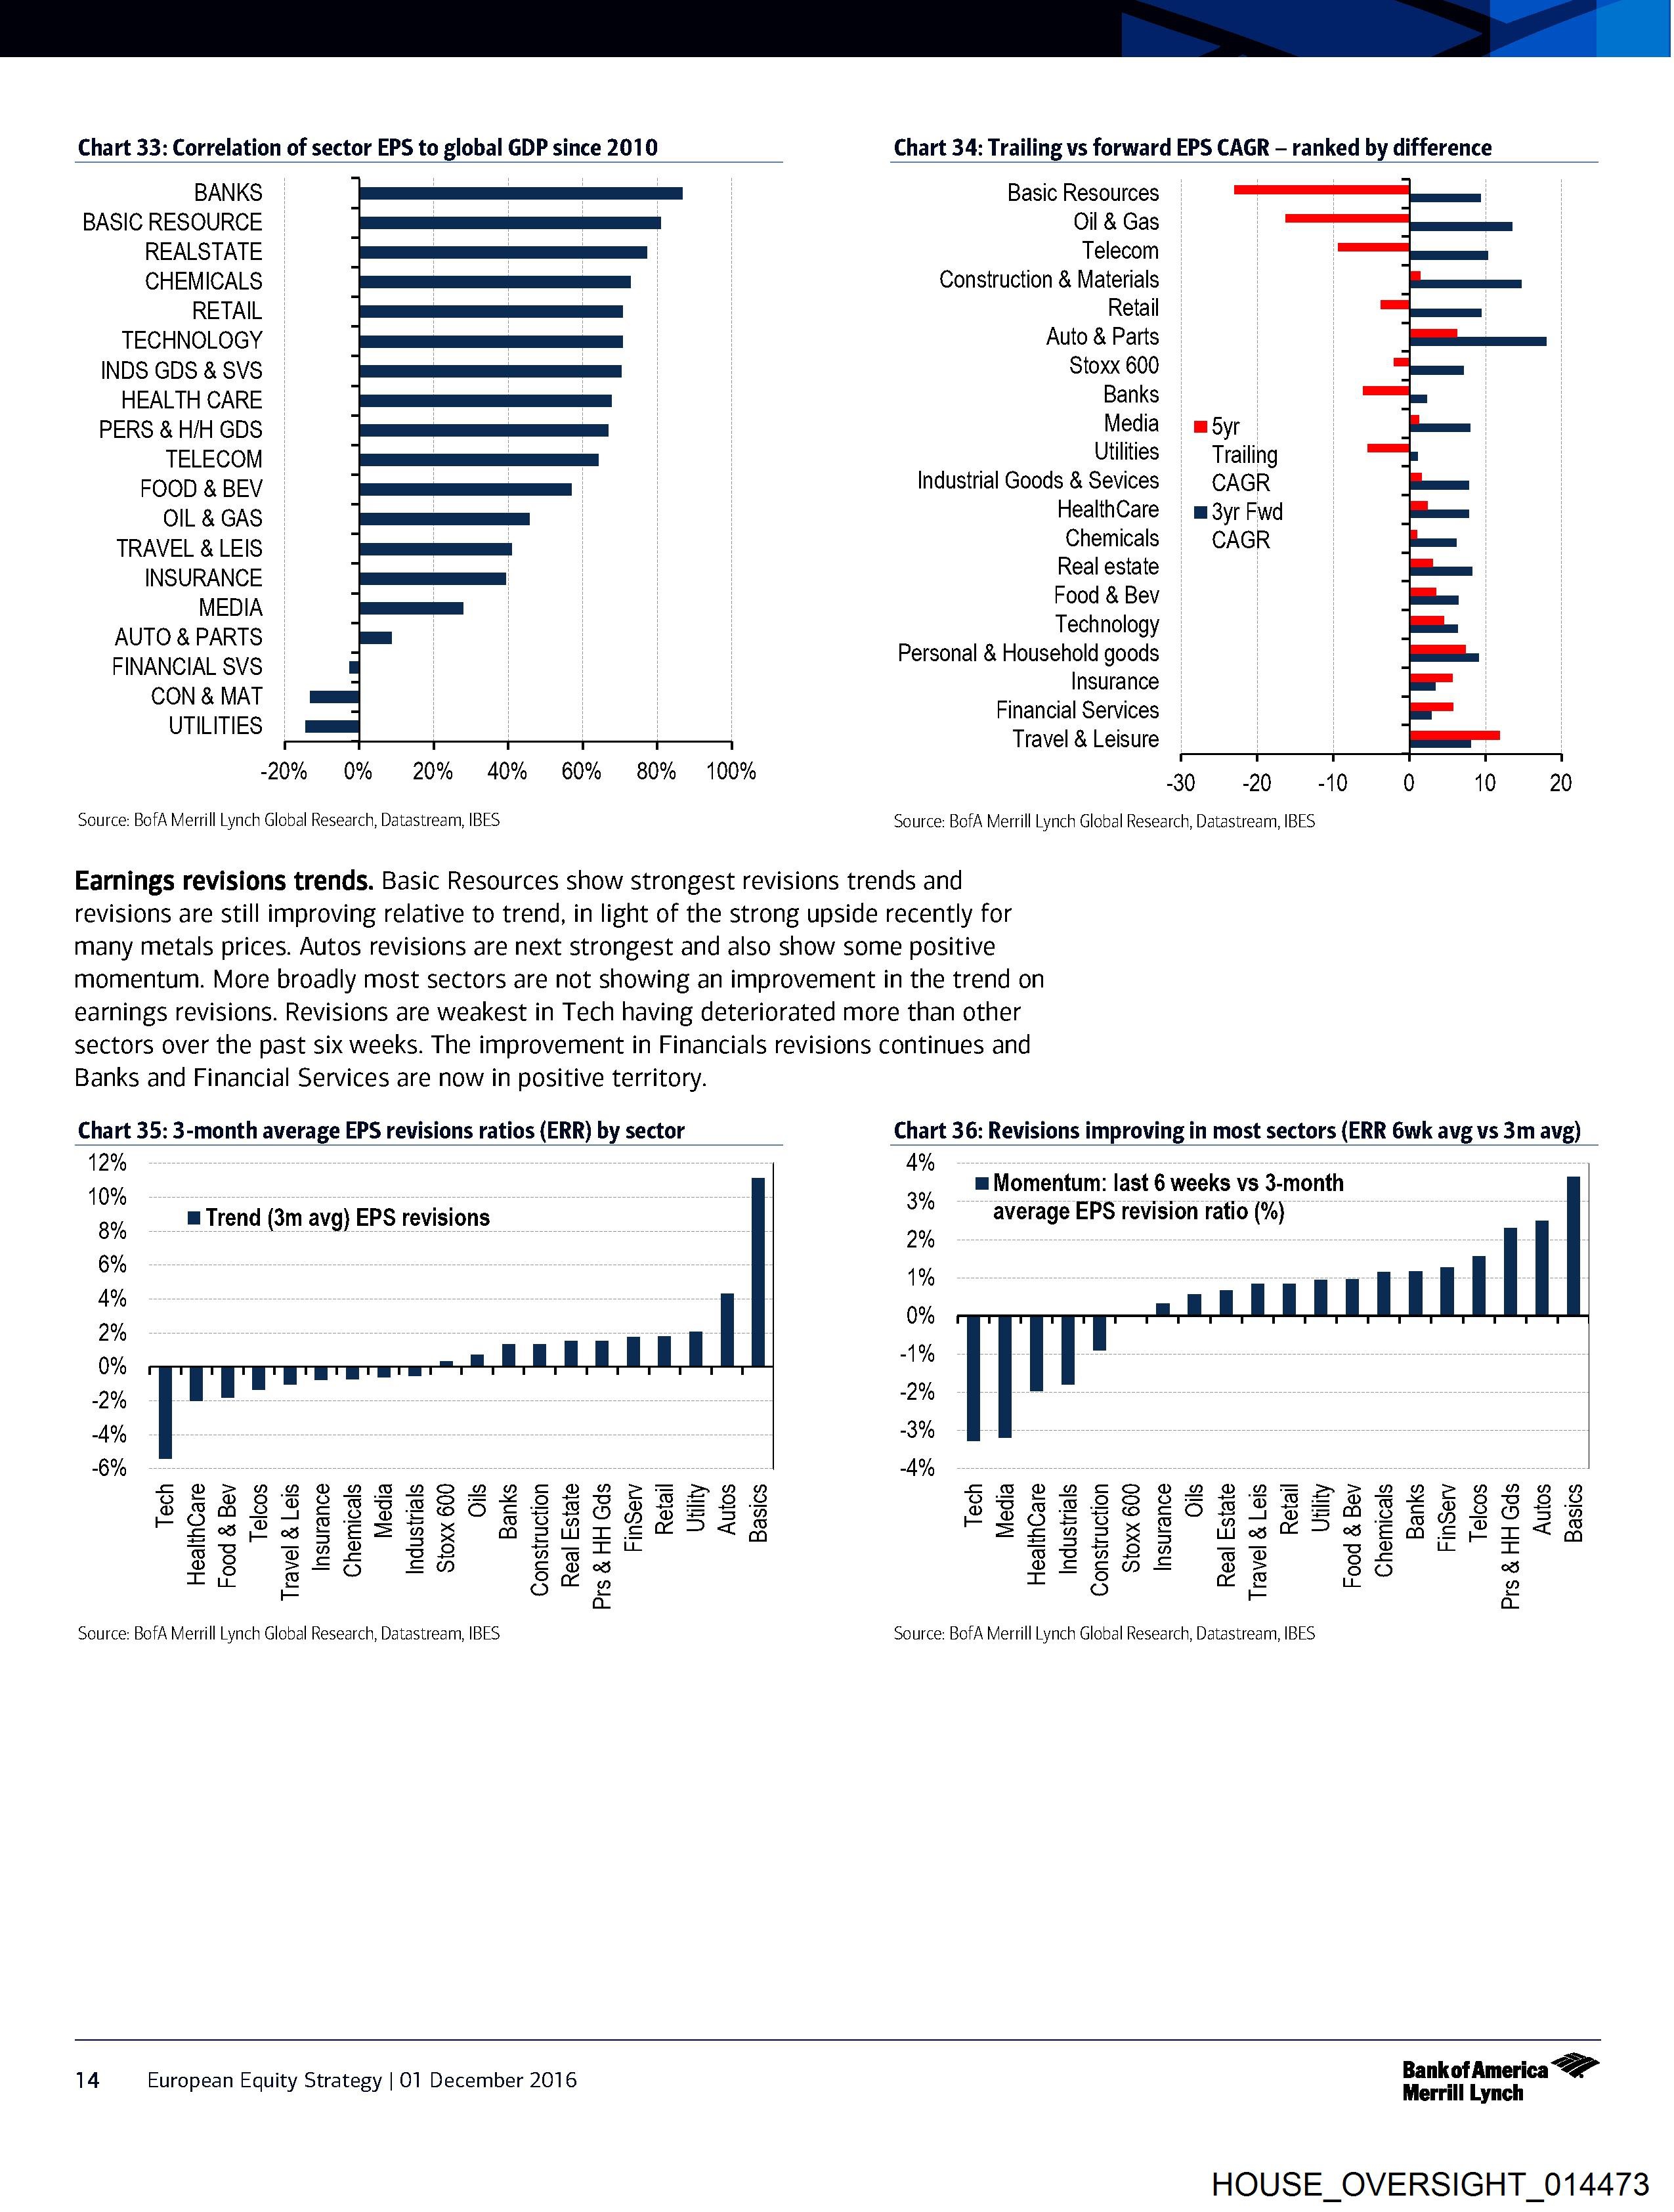
Chart 33: Correlation of sector EPS to global GDP since 2010 Chart 34: Trailing vs forward EPS CAGR - ranked by difference
BANKS Basic Resources
BASIC RESOURCE Oil & Gas
REALSTATE Telecom
CHEMICALS Construction & Materials
RETAIL Retail
TECHNOLOGY Auto & Parts
INDS GDS & SVS Stoxx 600
HEALTH CARE Banks
PERS & H/H GDS Media = m5yr |
TELECOM Utilities Trailing
FOOD & BEV Industrial Goods & Sevices CAGR
OIL & GAS HealthCare — m 3yr Fwd
TRAVEL & LEIS Chemicals CAGR
INSURANCE Real estate
MEDIA Food & Bev
Technology
AUTO & PARTS Personal & Household goods
FINANCIAL SVS (nerarerriea
GEN MAL Financial Services
UTILITIES Travel & Leisure
-20% 0% 20% 40% 60% 80% 100% 30 20 40 0 40 20
Source: BofA Merrill Lynch Global Research, Datastream, IBES Source: BofA Merrill Lynch Global Research, Datastream, IBES
Earnings revisions trends. Basic Resources show strongest revisions trends and
revisions are still improving relative to trend, in light of the strong upside recently for
many metals prices. Autos revisions are next strongest and also show some positive
momentum. More broadly most sectors are not showing an improvement in the trend on
earnings revisions. Revisions are weakest in Tech having deteriorated more than other
sectors over the past six weeks. The improvement in Financials revisions continues and
Banks and Financial Services are now in positive territory.
Chart 35: 3-month average EPS revisions ratios (ERR) by sector Chart 36: Revisions improving in most sectors (ERR 6wk avg vs 3m avg)
12% 4%
m= Momentum: last 6 weeks vs 3-month
10% 3% a sae
& Trend (3m avg) EPS revisions average EPS revision ratio (%)
)
Bi 2%
6%
1%
4% ;
2% O%
‘0
-1%
0% °
99
2% 2th
-A% 3%
6% 4%
SEOFRANAMADADAHE HDA FZTPE*”A RK SEREMOHR COMA HA HM H=~a SPFHHFHMAA”R
Gof ® 6 ° SO=zr~s~ onus SH’ so oO oO = Soot Sf ® ee on 6 Oo
PSagir gs Bessy sO$ sess PBSLSS ESCORT SSASESSSER
SePfsa SSS Se mastirer Ag SPEGSES Oot -weme Prt s
eB p22 38 G@aertt esreaS2 a8 epee * =
® 8 re) En SO es ®9EeEecVnE o> 85 oS
Iie © & Cw = & [ae rm oO
E 2 E 2
oO oO
Source: BofA Merrill Lynch Global Research, Datastream, IBES Source: BofA Merrill Lynch Global Research, Datastream, IBES
5: Bankot America
14 European Equity Strate: 01 December 2016 i
P quity By | Merrill Lynch
HOUSE_OVERSIGHT_014473
Document Preview

Click to view full size
Document Details
| Filename | HOUSE_OVERSIGHT_014473.jpg |
| File Size | 0.0 KB |
| OCR Confidence | 85.0% |
| Has Readable Text | Yes |
| Text Length | 2,274 characters |
| Indexed | 2026-02-04T16:22:37.273178 |