HOUSE_OVERSIGHT_014542.jpg
Extracted Text (OCR)
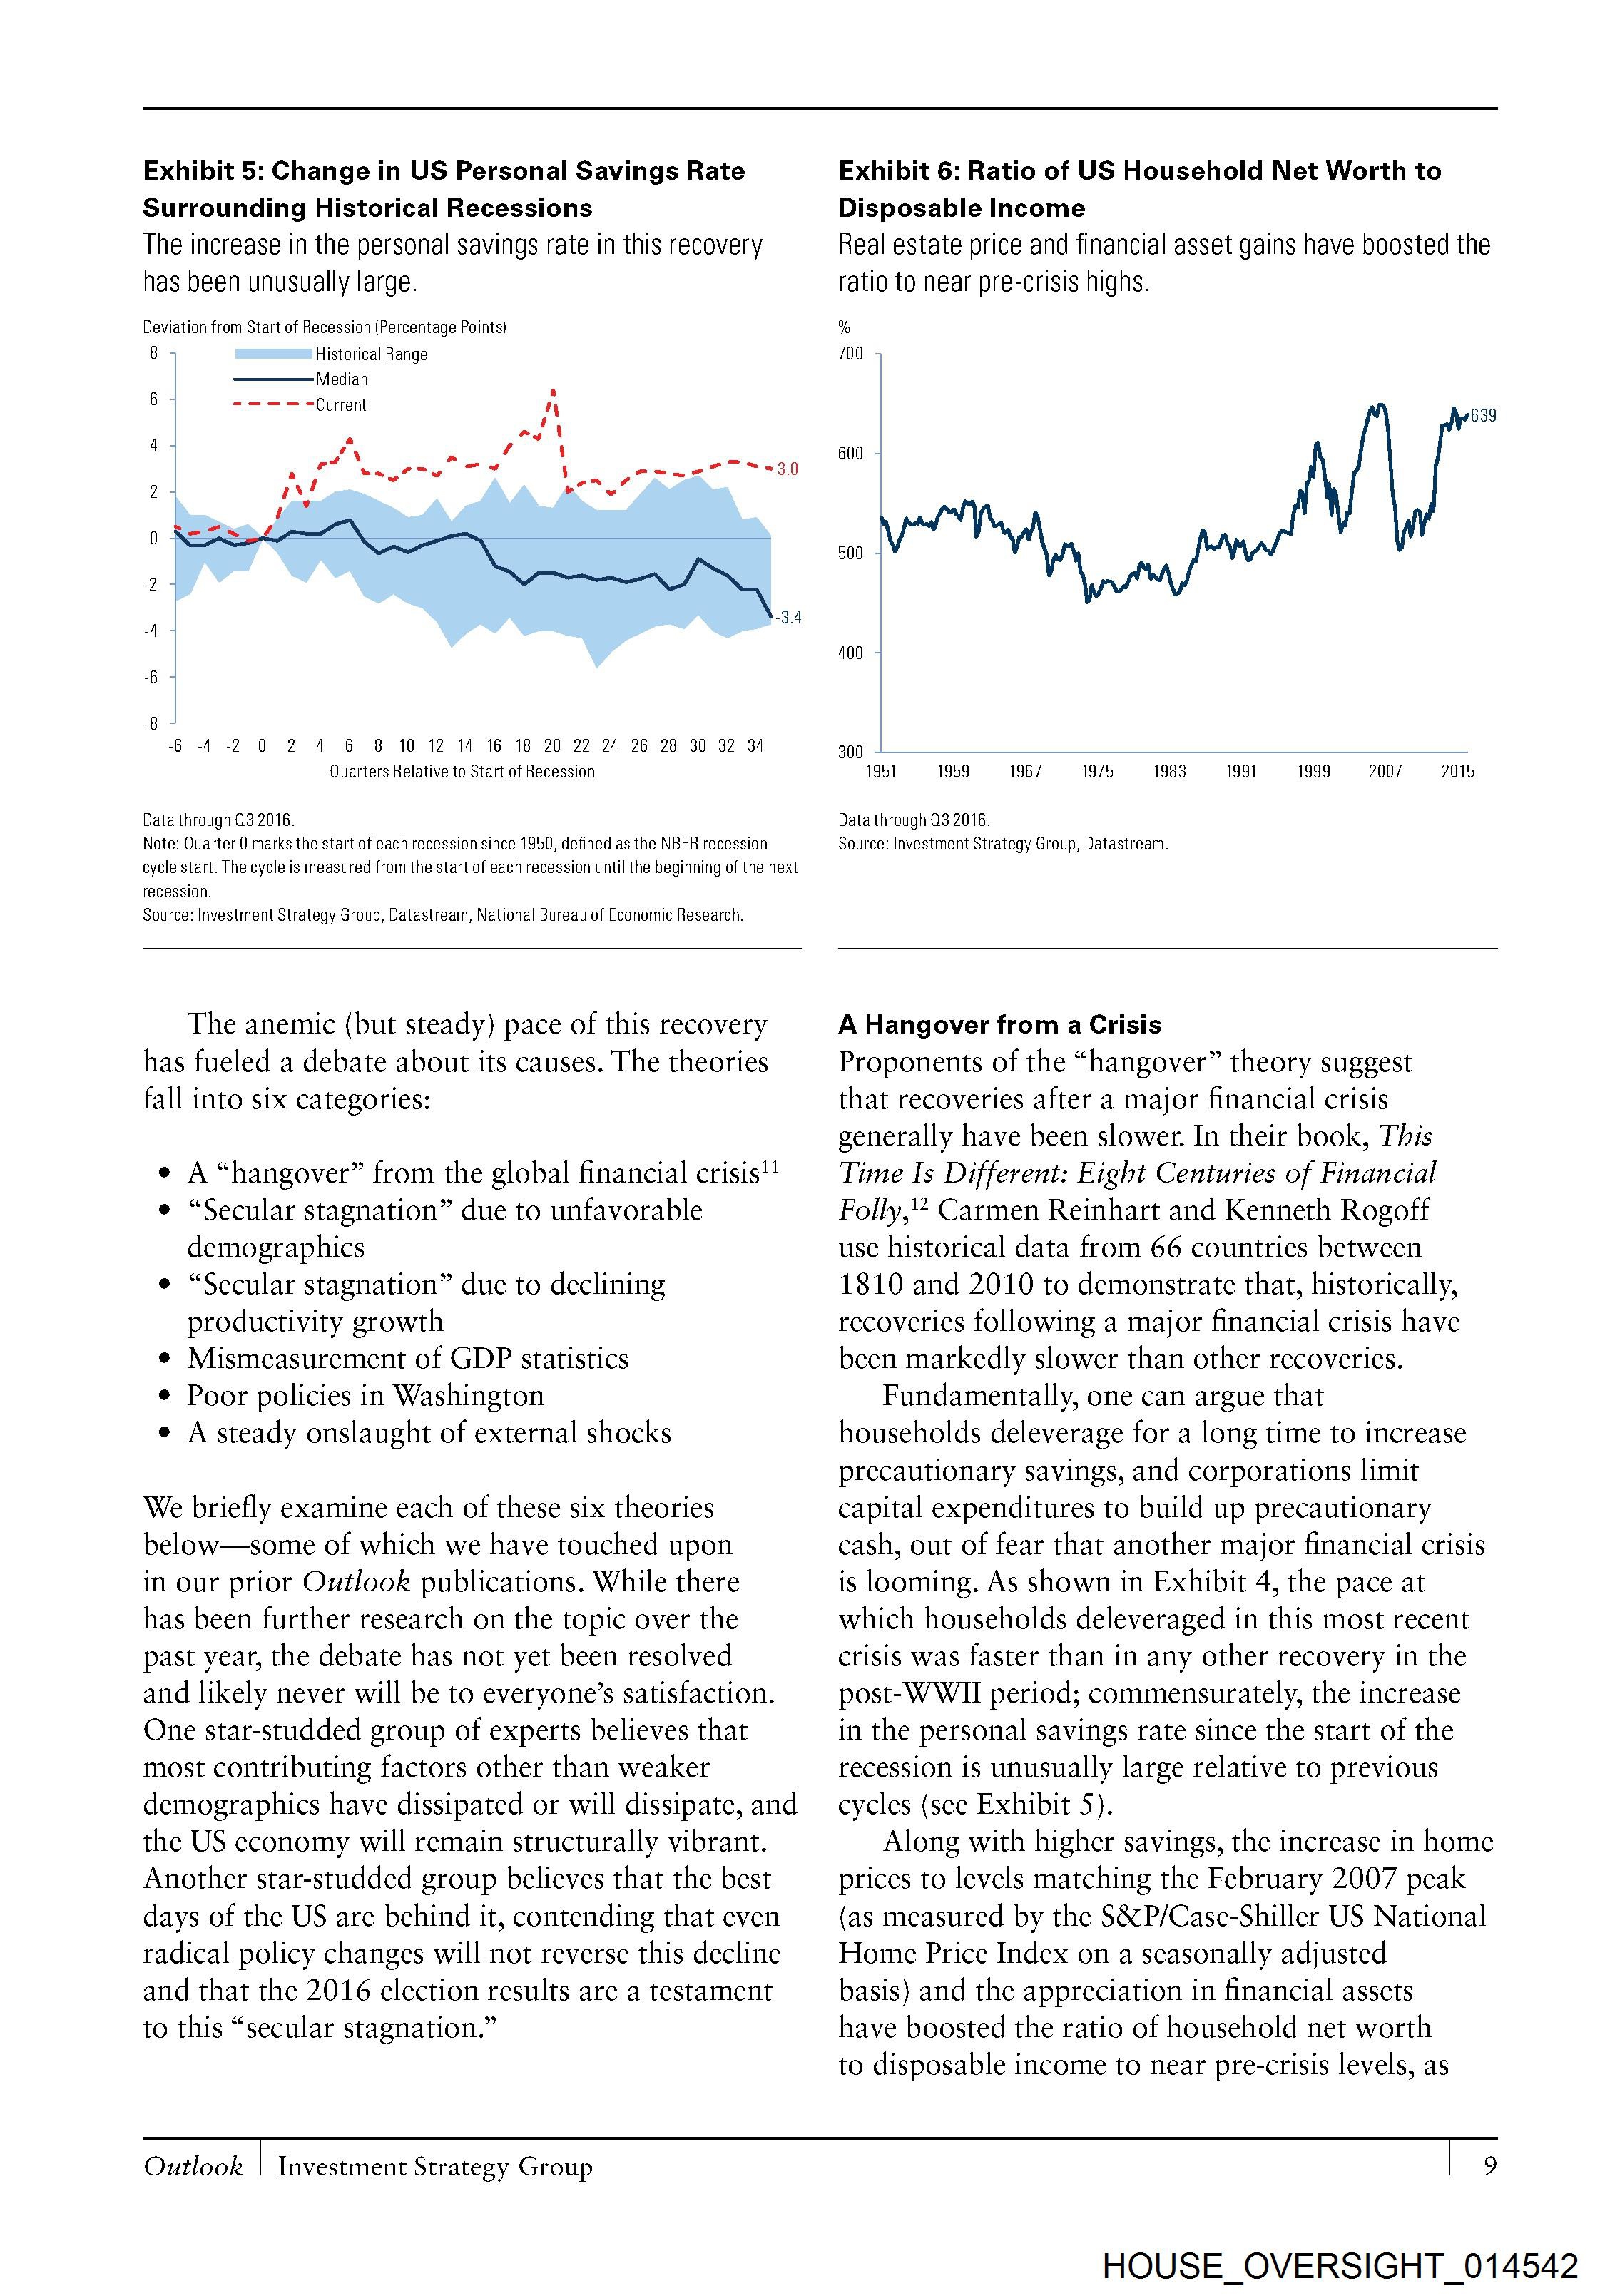
Exhibit 5: Change in US Personal Savings Rate
Surrounding Historical Recessions
The increase in the personal savings rate in this recovery
has been unusually large.
Deviation from Start of Recession (Percentage Points)
8 Historical Range
Median
a
By aaa Current iy
6 4-2 0 2 4 6
8 10 12 14 16 18 20 22 24 26 28 30 32 34
Quarters Relative to Start of Recession
Data through 03 2016.
Note: Quarter 0 marks the start of each recession since 1950, defined as the NBER recession
cycle start. The cycle is measured from the start of each recession until the beginning of the next
recession.
Source: Investment Strategy Group, Datastream, National Bureau of Economic Research.
Exhibit 6: Ratio of US Household Net Worth to
Disposable Income
Real estate price and financial asset gains have boosted the
ratio to near pre-crisis highs.
%
700
639
600
500 -
400
300 +
1951 1959 1967 1975 1983 1991 1999 2007 2015
Data through 03 2016.
Source: Investment Strategy Group, Datastream.
The anemic (but steady) pace of this recovery
has fueled a debate about its causes. The theories
fall into six categories:
e A “hangover” from the global financial crisis’!
e “Secular stagnation” due to unfavorable
demographics
* “Secular stagnation” due to declining
productivity growth
¢ Mismeasurement of GDP statistics
* Poor policies in Washington
e A steady onslaught of external shocks
We briefly examine each of these six theories
below—some of which we have touched upon
in our prior Outlook publications. While there
has been further research on the topic over the
past year, the debate has not yet been resolved
and likely never will be to everyone’s satisfaction.
One star-studded group of experts believes that
most contributing factors other than weaker
demographics have dissipated or will dissipate, and
the US economy will remain structurally vibrant.
Another star-studded group believes that the best
days of the US are behind it, contending that even
radical policy changes will not reverse this decline
and that the 2016 election results are a testament
to this “secular stagnation.”
A Hangover from a Crisis
Proponents of the “hangover” theory suggest
that recoveries after a major financial crisis
generally have been slower. In their book, This
Time Is Different: Eight Centuries of Financial
Folly, Carmen Reinhart and Kenneth Rogoff
use historical data from 66 countries between
1810 and 2010 to demonstrate that, historically,
recoveries following a major financial crisis have
been markedly slower than other recoveries.
Fundamentally, one can argue that
households deleverage for a long time to increase
precautionary savings, and corporations limit
capital expenditures to build up precautionary
cash, out of fear that another major financial crisis
is looming. As shown in Exhibit 4, the pace at
which households deleveraged in this most recent
crisis was faster than in any other recovery in the
post-WWII period; commensurately, the increase
in the personal savings rate since the start of the
recession is unusually large relative to previous
cycles (see Exhibit 5).
Along with higher savings, the increase in home
prices to levels matching the February 2007 peak
(as measured by the S&P/Case-Shiller US National
Home Price Index on a seasonally adjusted
basis} and the appreciation in financial assets
have boosted the ratio of household net worth
to disposable income to near pre-crisis levels, as
Outlook | Investment Strategy Group 9
HOUSE_OVERSIGHT_014542
Document Preview

Click to view full size
Document Details
| Filename | HOUSE_OVERSIGHT_014542.jpg |
| File Size | 0.0 KB |
| OCR Confidence | 85.0% |
| Has Readable Text | Yes |
| Text Length | 3,496 characters |
| Indexed | 2026-02-04T16:22:52.056702 |