HOUSE_OVERSIGHT_014898.jpg
Extracted Text (OCR)
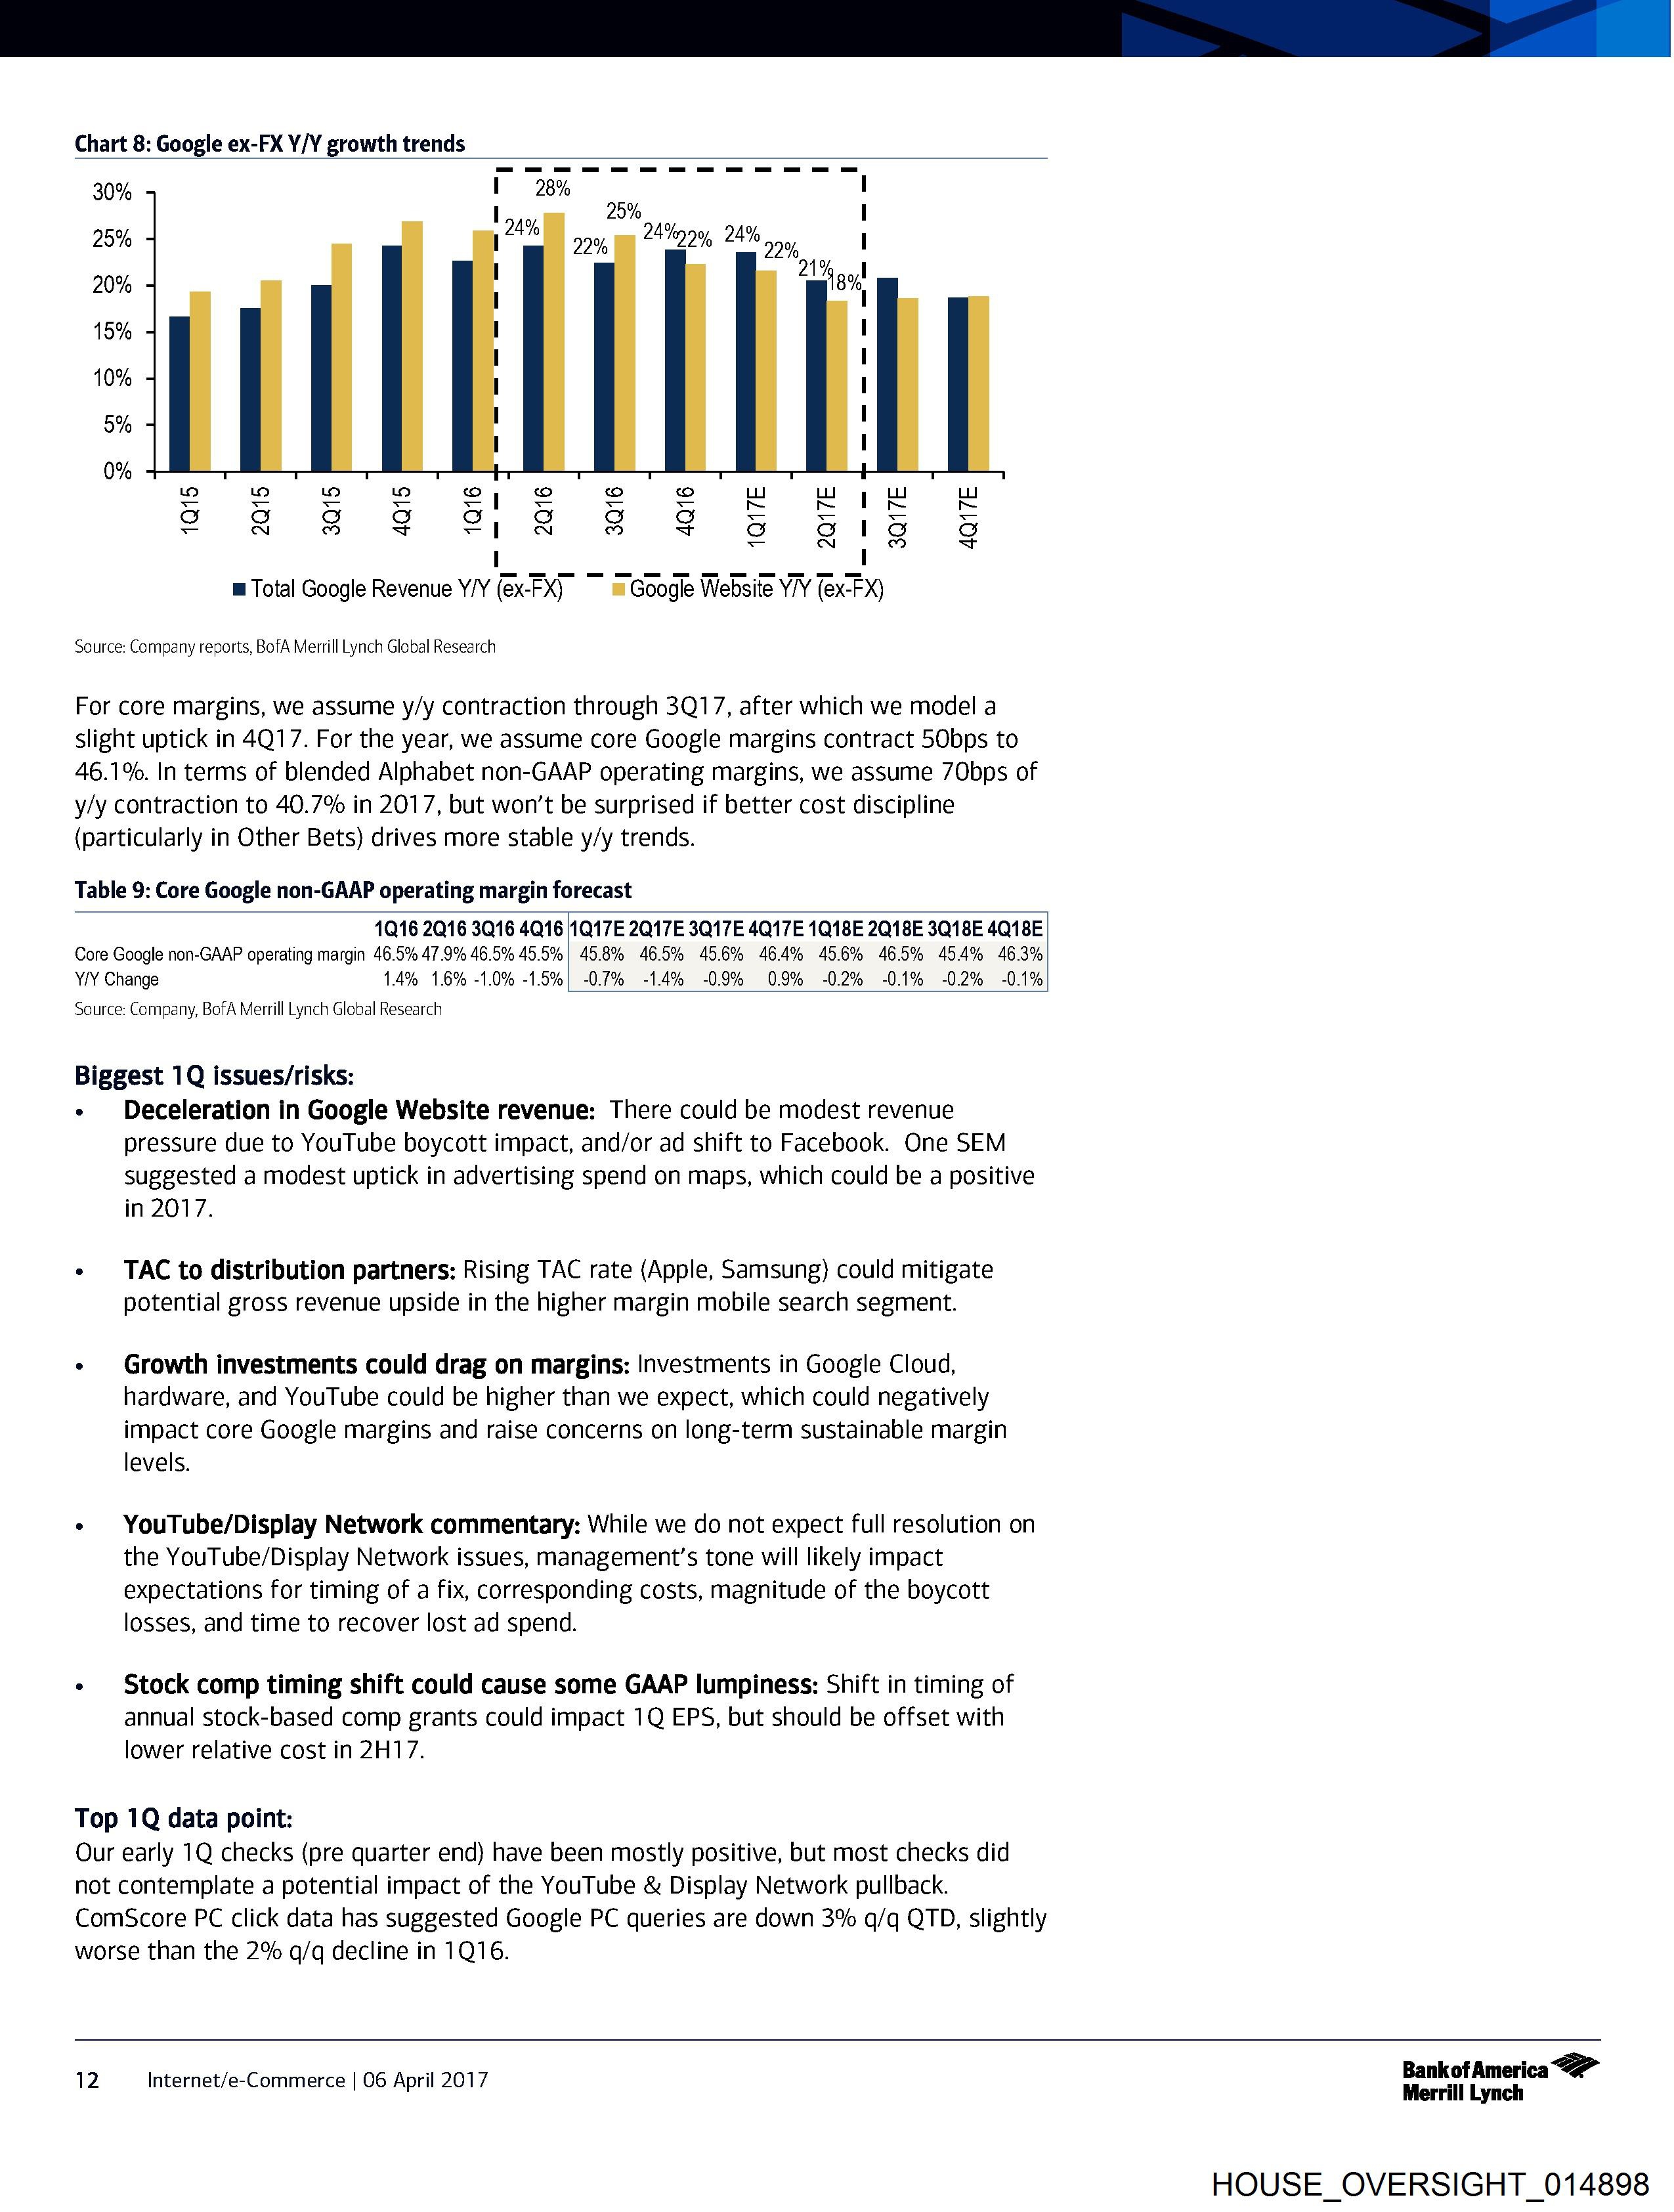
Chart 8: Google ex-FX Y/Y growth trends
30%
25% 24%y9% 24%
20%
15%
10%
5%
0%
22%
2Q17E
3Q17E
A4Q17E
@ Total Google Revenue Y/Y (ex-FX) m= Google Website Y/Y (ex-FX)
Source: Company reports, BofA Merrill Lynch Global Research
For core margins, we assume y/y contraction through 3Q17, after which we model a
slight uptick in 4Q17. For the year, we assume core Google margins contract 50bps to
46.1%. In terms of blended Alphabet non-GAAP operating margins, we assume 7Obps of
y/y contraction to 40.7% in 2017, but won't be surprised if better cost discipline
(particularly in Other Bets) drives more stable y/y trends.
Table 9: Core Google non-GAAP operating margin forecast
1016 2016 3Q16 4016 1Q17E 2Q17E 3Q17E 4Q17E 1Q18E 2018E 3Q18E 4Q18E
Core Google non-GAAP operating margin 46.5% 47.9% 46.5% 45.5% | 45.8% 46.5% 45.6% 46.4% 45.6% 46.5% 454% 46.3%
YN Change 1.4% 1.6% -1.0% -1.5%| -0.7% -14% -0.9% 0.9% -0.2% -0.1% -0.2% -0.1%
Source: Company, BofA Merrill Lynch Global Research
Biggest 1Q issues/risks:
- Deceleration in Google Website revenue: There could be modest revenue
pressure due to YouTube boycott impact, and/or ad shift to Facebook. One SEM
suggested a modest uptick in advertising spend on maps, which could be a positive
in 2017.
¢ TAC to distribution partners: Rising TAC rate (Apple, Samsung} could mitigate
potential gross revenue upside in the higher margin mobile search segment.
¢ Growth investments could drag on margins: Investments in Google Cloud,
hardware, and YouTube could be higher than we expect, which could negatively
impact core Google margins and raise concerns on long-term sustainable margin
levels.
* YouTube/Display Network commentary: While we do not expect full resolution on
the YouTube/Display Network issues, management’s tone will likely impact
expectations for timing of a fix, corresponding costs, magnitude of the boycott
losses, and time to recover lost ad spend.
¢ Stock comp timing shift could cause some GAAP lumpiness: Shift in timing of
annual stock-based comp grants could impact 1Q EPS, but should be offset with
lower relative cost in 2H17.
Top 1Q data point:
Our early 1Q checks (pre quarter end) have been mostly positive, but most checks did
not contemplate a potential impact of the YouTube & Display Network pullback.
ComScore PC click data has suggested Google PC queries are down 3% q/q QTD, slightly
worse than the 2% q/q decline in 1Q16.
BankofAmerica <2”
12 Internet/e-Commerce | 06 April 2017 Merrill Lynch
HOUSE_OVERSIGHT_014898
Document Preview

Click to view full size
Document Details
| Filename | HOUSE_OVERSIGHT_014898.jpg |
| File Size | 0.0 KB |
| OCR Confidence | 85.0% |
| Has Readable Text | Yes |
| Text Length | 2,522 characters |
| Indexed | 2026-02-04T16:24:02.552191 |