HOUSE_OVERSIGHT_014974.jpg
Extracted Text (OCR)
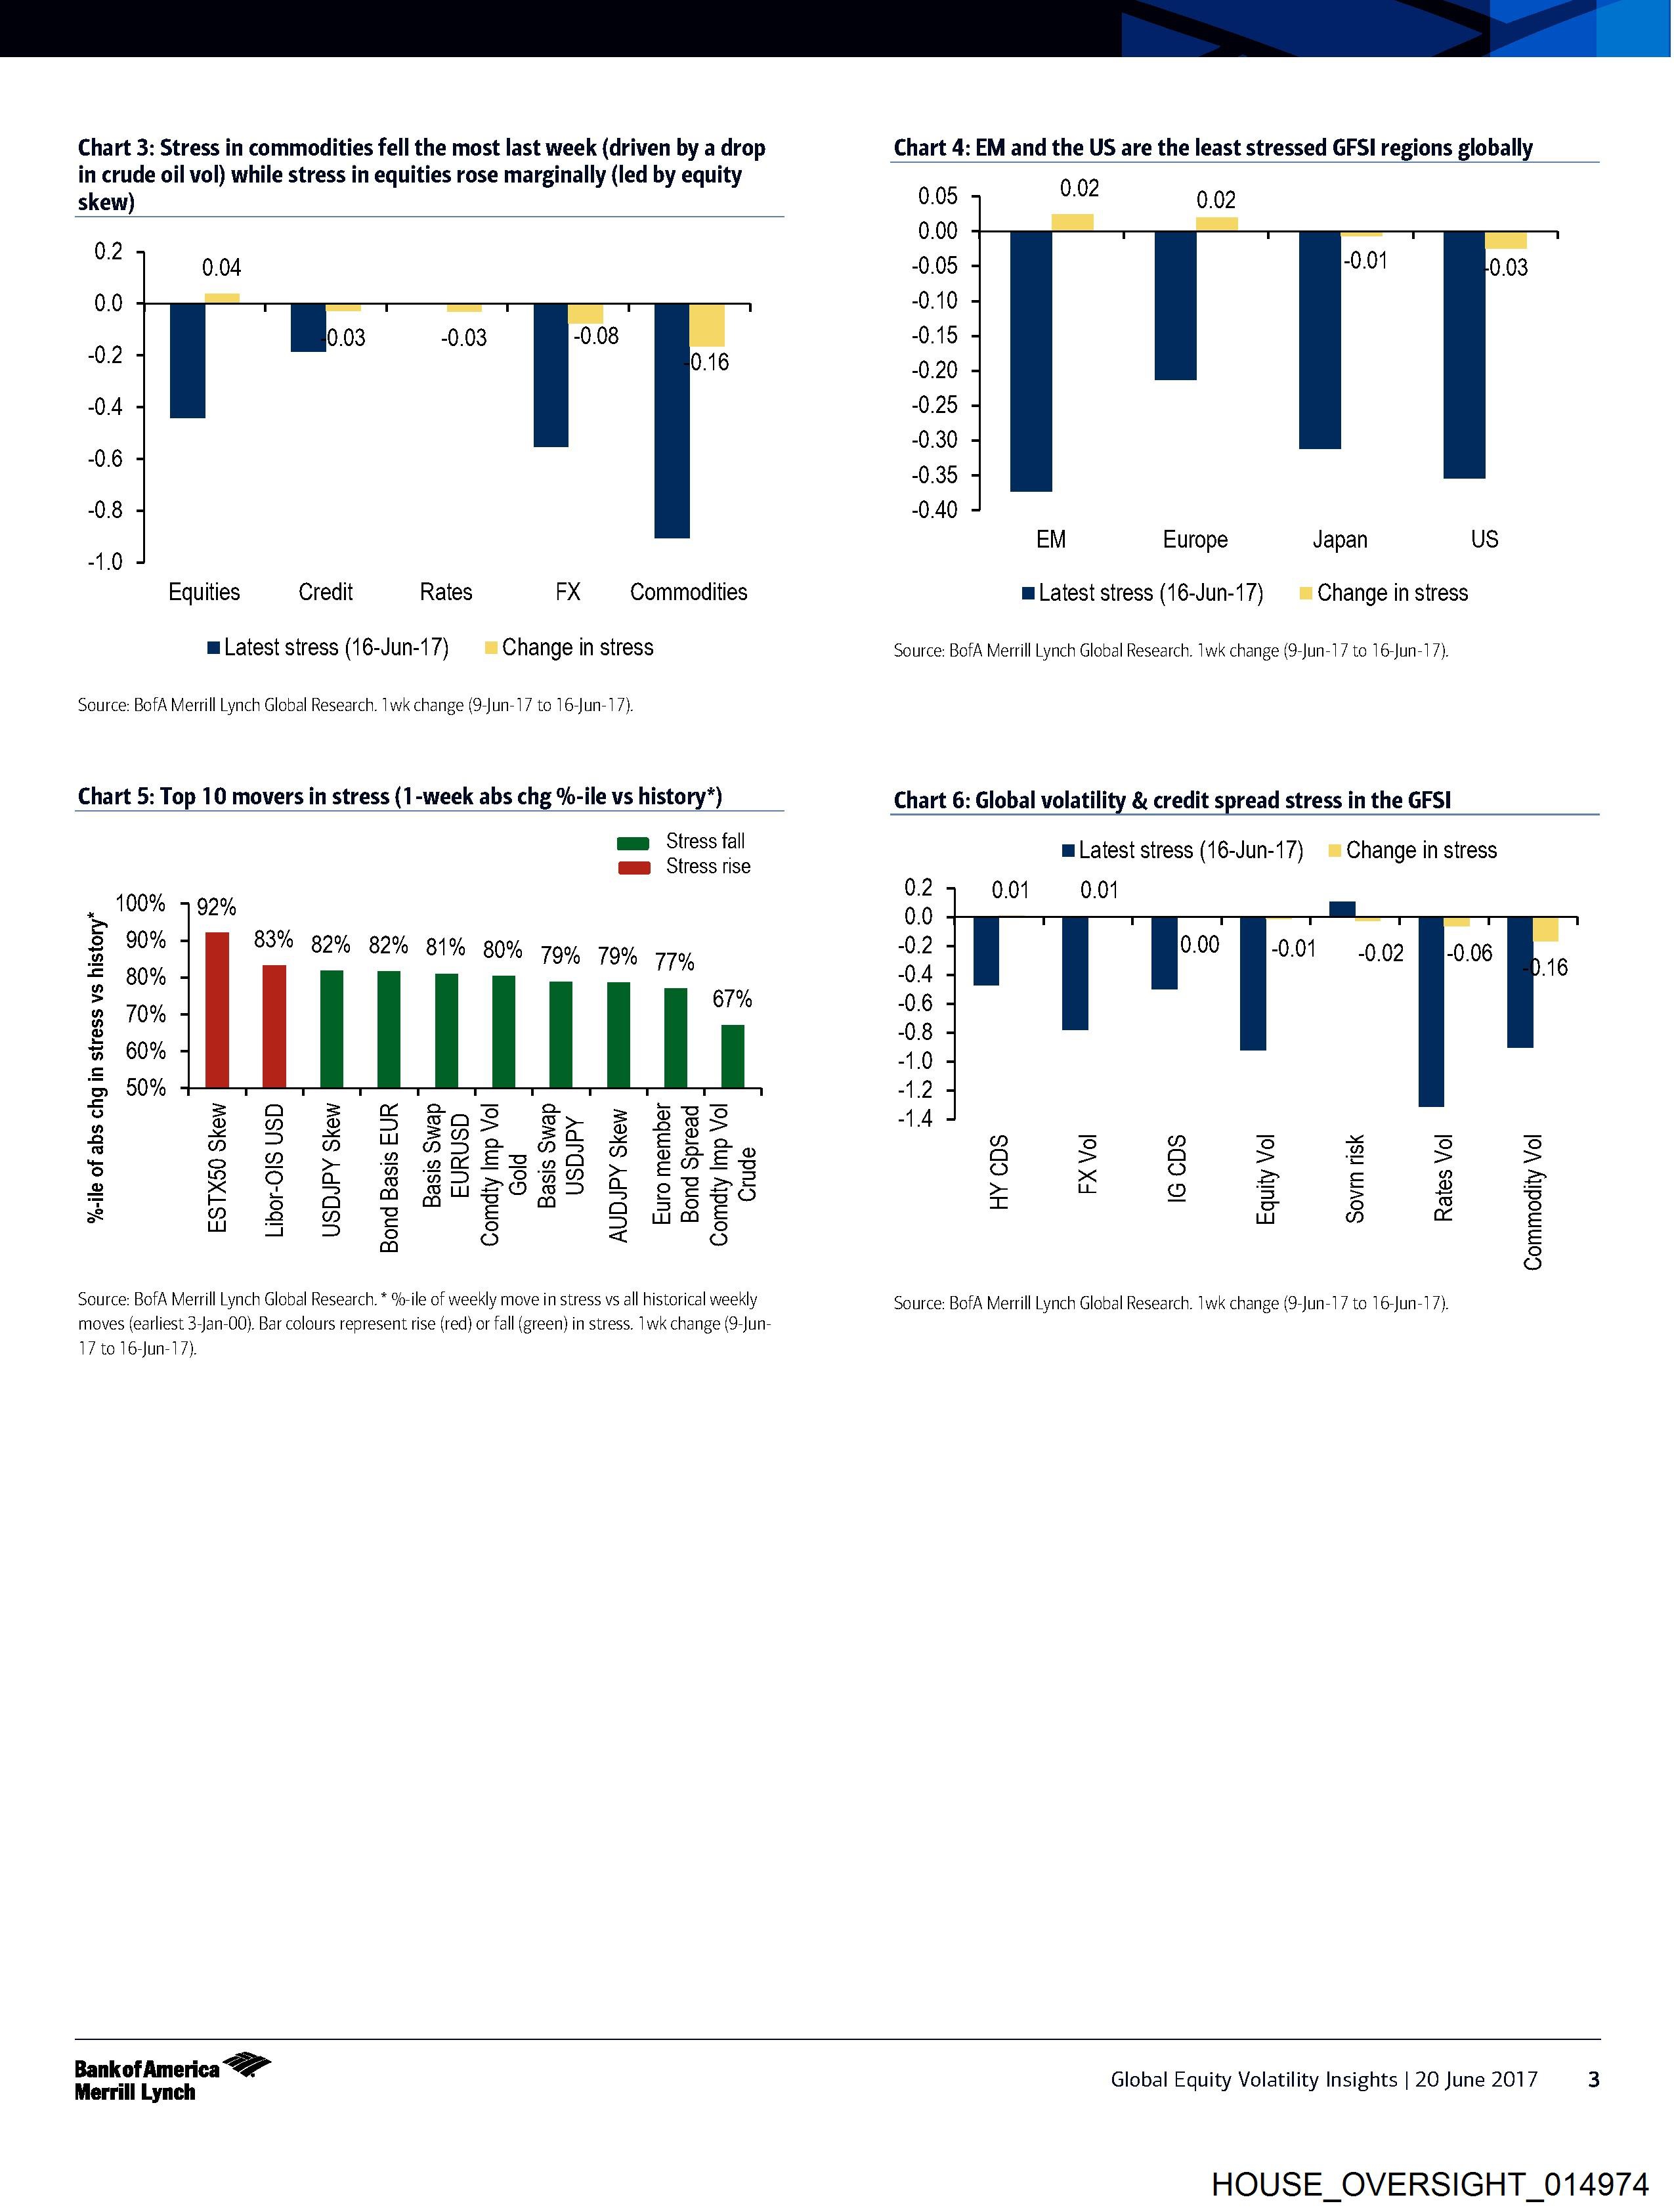
Chart 3: Stress in commodities fell the most last week (driven by a drop Chart 4: EM and the US are the least stressed GFSI regions globally
in crude oil vol) while stress in equities rose marginally (led by equity 0.02
skew) 0.05 0.02
02 0.00 —
, -0.05
0.0 -0.10
5% -0.15
~ -0.20
-0.4 -0.25
06 -0.30
~ 0.35
-0.8 -0.40
40 EM Europe Japan US
Equities Credit Rates FX Commodities mLatest stress (16-Jun-17) | © Change in stress
mLatest stress (16-Jun-17) | © Change in stress Source: BofA Merrill Lynch Global Research. 1wk change (9-Jun-17 to 16-Jun-17).
Source: BofA Merrill Lynch Global Research. 1wk change (9-Jun-17 to 16-Jun-17).
Chart 5: Top 10 movers in stress (1-week abs chg %-ile vs history*) Chart 6: Global volatility & credit spread stress in the GFSI
me Stress fall mLatest stress (16-Jun-17) = Change in stress
gam Stress rise
_ 100% 792% 3 0.01 0.01
o :
2 90% 83% 82% 82% 81% 80% 799 79% 77% 0.2
~ 80% 679% -0.4
g 5 -0.6
2 ° -1.0
‘am 50% -1.2
3
a
oS
S
2
a Ss fom =
6B 6 S §oS S> § SBE 14
@ - © YY GS5e S565 F $520 2) 3 2 3S x S s
(ep) 2) res a CAE a > a > = > >
2 > @% 2f& SSa > EVES ro) rs)
1 fo) a 6 ARO >2 aM A OwD Pad ry i= R =
Sx f£ 3 Am 8BULOGDXD SF GP 225 > fe oO £ = Rs) =
- ° a a so] [aa] Oo se8 = = > {o) & fo)
i § 8 & 5 5S uma§ Lu (os) ow 2
3
a ro) < ro) €
Oo
Source: BofA Merrill Lynch Global Research. * %-ile of weekly mave in stress vs all historical weekly Source: BofA Merrill Lynch Global Research. 1wk change (9-Jun-17 to 16-Jun-17).
moves (earliest 3-Jan-00). Bar colours represent rise (red) or fall (green) in stress. 1wk change (9-Jun-
17 to 16-Jun-17).
Bankof America . dee docs
z Global Equity Volatility Insights | 20 June 2017
Merrill Lynch quity plnsrents | 28) a
HOUSE_OVERSIGHT_014974
Document Preview

Click to view full size
Document Details
| Filename | HOUSE_OVERSIGHT_014974.jpg |
| File Size | 0.0 KB |
| OCR Confidence | 85.0% |
| Has Readable Text | Yes |
| Text Length | 1,742 characters |
| Indexed | 2026-02-04T16:24:19.577953 |