HOUSE_OVERSIGHT_014977.jpg
Extracted Text (OCR)
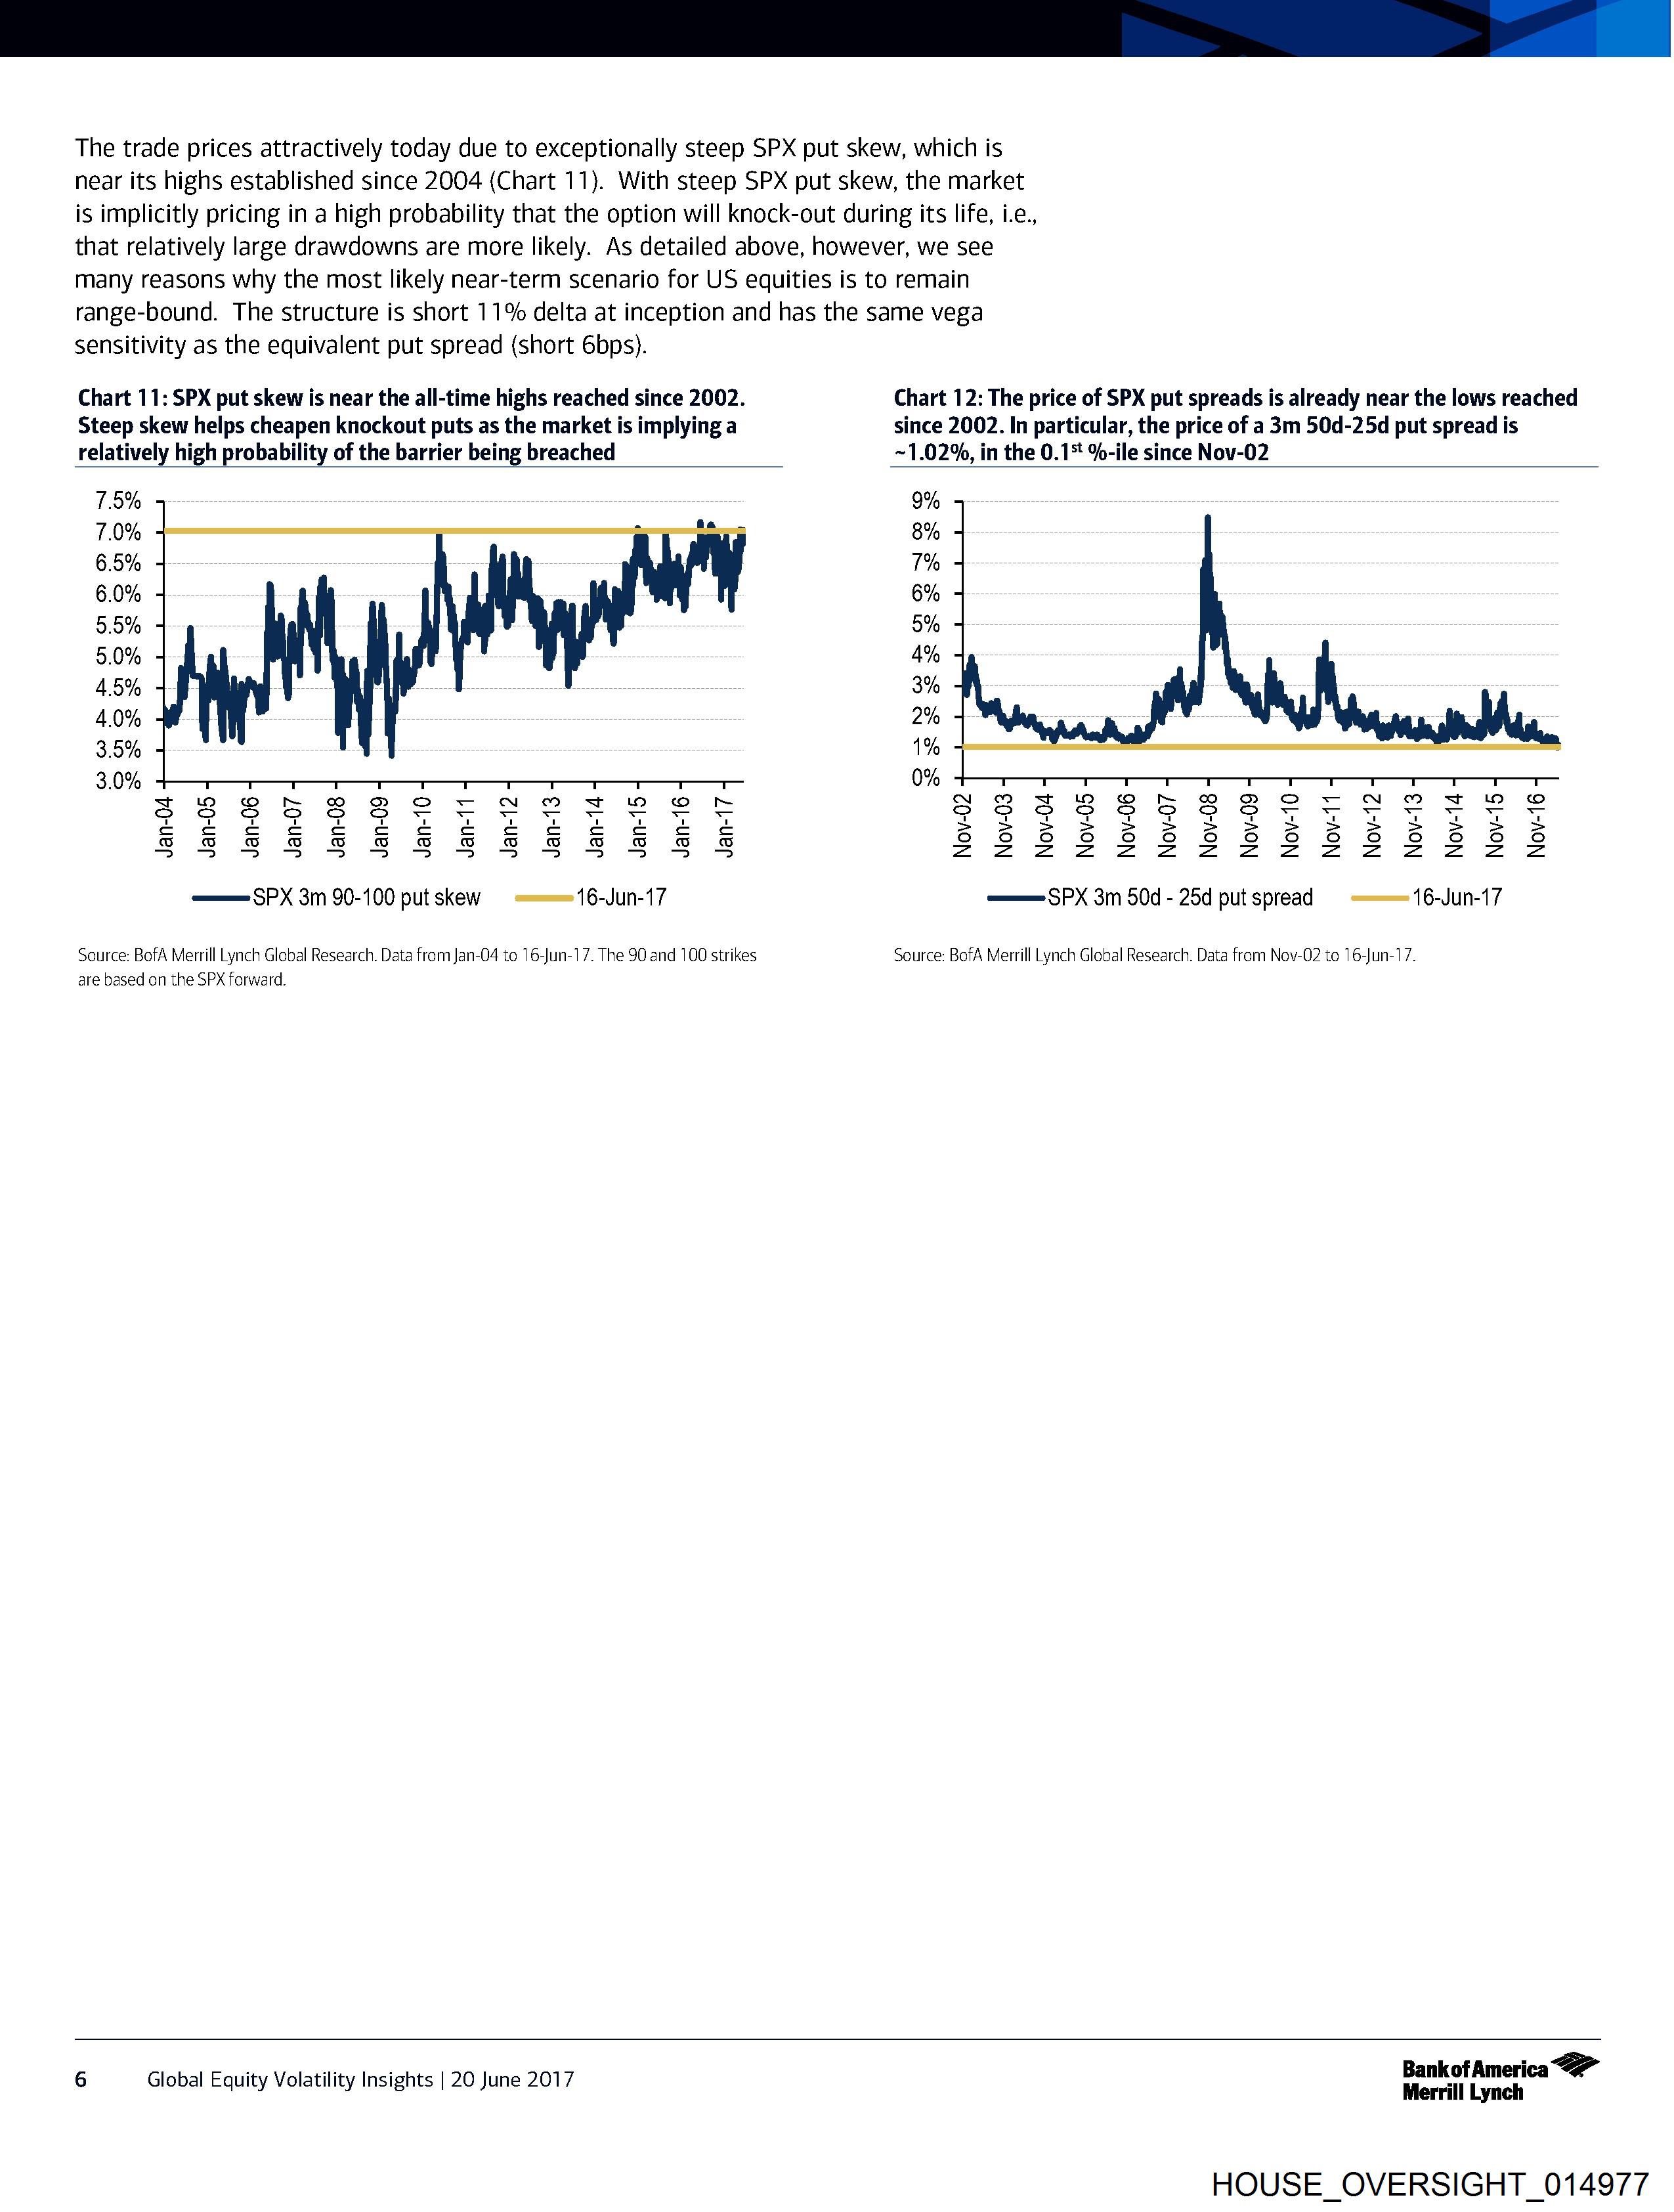
The trade prices attractively today due to exceptionally steep SPX put skew, which is
near its highs established since 2004 (Chart 11). With steep SPX put skew, the market
is implicitly pricing in a high probability that the option will knock-out during its life, i-e.,
that relatively large drawdowns are more likely. As detailed above, however, we see
many reasons why the most likely near-term scenario for US equities is to remain
range-bound. The structure is short 11% delta at inception and has the same vega
sensitivity as the equivalent put spread (short 6bps).
Chart 11: SPX put skew is near the all-time highs reached since 2002. Chart 12: The price of SPX put spreads is already near the lows reached
Steep skew helps cheapen knockout puts as the market is implying a since 2002. In particular, the price of a 3m 50d-25d put spread is
relatively high probability of the barrier being breached ~1.02%, in the 0.15 %-ile since Nov-02
7.5% 9%
7.0% 8%
6.5% 7%
6.0% 6%
5.5% 5%
5.0% 4%
4.5% 3%
4.0% 2%
3.5% 1%
3.0% 0%
S8SESRSSEN SF ESE sssssggsergeres
SEES EERE SEE EEE S SSssSsESS8S8S888
——— SPX 3m 90-100 put skew = === 16-Jun-17 ——=SPX 3m 50d - 25d put spread = == 16-Jun-17
Source: BofA Merrill Lynch Global Research. Data from Jan-04 to 16-Jun-17. The 90 and 100 strikes Source: BofA Merrill Lynch Global Research. Data from Nov-02 to 16-Jun-17.
are based on the SPX forward.
, aeificd Bankof America
6 Global Equity Volatility Insights | 20 June 2017 Merrill Lynch
HOUSE_OVERSIGHT_014977
Document Preview

Click to view full size
Document Details
| Filename | HOUSE_OVERSIGHT_014977.jpg |
| File Size | 0.0 KB |
| OCR Confidence | 85.0% |
| Has Readable Text | Yes |
| Text Length | 1,502 characters |
| Indexed | 2026-02-04T16:24:20.221533 |