HOUSE_OVERSIGHT_014983.jpg
Extracted Text (OCR)
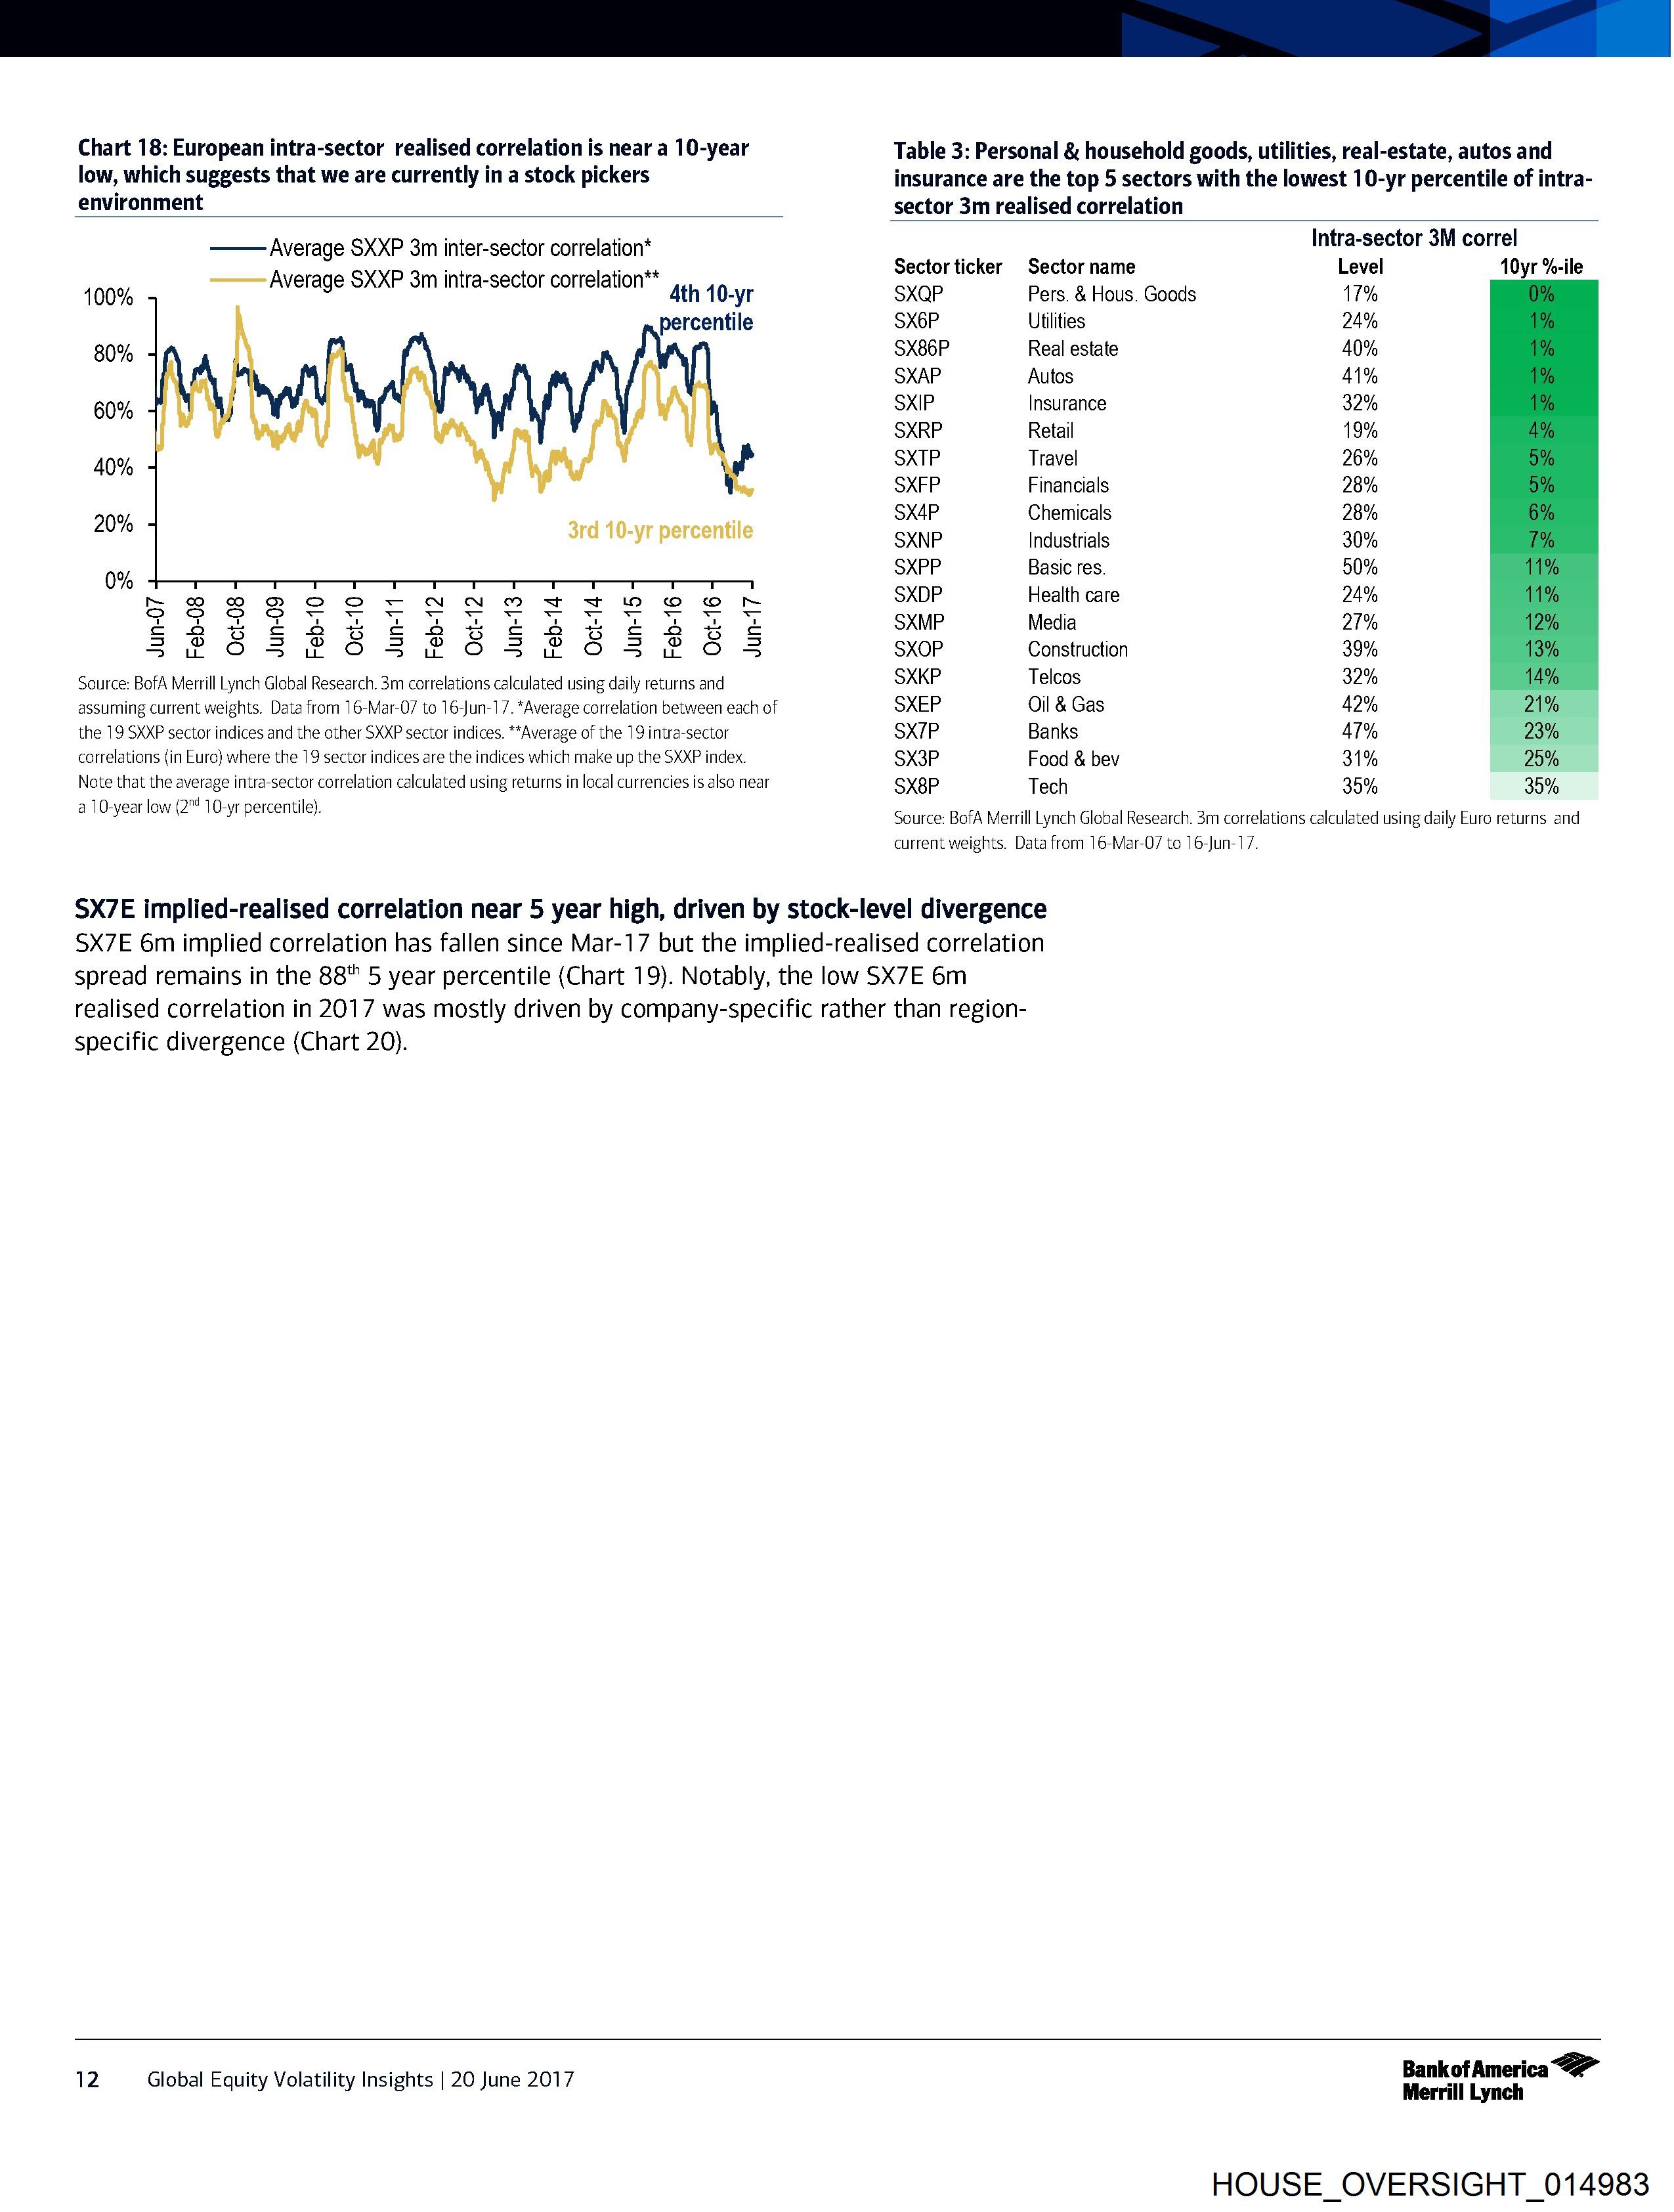
Chart 18: European intra-sector realised correlation is near a 10-year Table 3: Personal & household goods, utilities, real-estate, autos and
low, which suggests that we are currently in a stock pickers insurance are the top 5 sectors with the lowest 10-yr percentile of intra-
environment sector 3m realised correlation
Average SXXP 3m inter-sector correlation* Intra-sector 3M correl
Average SXXP 3m intra-sector correlation** Sectorticker Sector.name Level 1a elle
100% 4th 10-yr SXQP Pers. & Hous. Goods 17%
percentile SX6P Utilities 24%
80% SX86P Real estate 40%
SXAP Autos 41%
60% SXIP Insurance 32%
SXRP Retail 19%
40% SXTP Travel 26%
SXFP Financials 28%
20% ; SX4P Chemicals 28%
3rd 10-yr percentile SXNP industrials 30%
0% SXPP Basic res. 50%
b 2B R2RSSHTNNMDTYTOH OOK SXDP Health care 24%
a a a SXMP Media 27%
SPos P00 SsPA8 P68 P56 8 SXOP Construction 39%
Source: BofA Merrill Lynch Global Research. 3m correlations calculated using daily returns and SXKP Telcos 32%
assuming current weights. Data from 16-Mar-07 to 16-Jun-17. *Average correlation between each of SXEP Oil & Gas 42%
the 19 SXXP sector indices and the other SXXP sector indices. **Average of the 19 intra-sector SX7P Banks 41% 2
correlations (in Euro) where the 19 sector indices are the indices which make up the SXXP index. SX3P Food & bev 31% 25%
Note that the average intra-sector correlation calculated using returns in local currencies is also near Sx8P Tech 35% 35%
Z nd o .
ai Tgearlond2” Miynpercentiley Source: BofA Merrill Lynch Global Research. 3m correlations calculated using daily Euro returns and
current weights. Data from 16-Mar-07 to 16-Jun-17.
SX7E implied-realised correlation near 5 year high, driven by stock-level divergence
SX7E 6m implied correlation has fallen since Mar-17 but the implied-realised correlation
spread remains in the 88" 5 year percentile (Chart 19). Notably, the low SX7E 6m
realised correlation in 2017 was mostly driven by company-specific rather than region-
specific divergence (Chart 20).
deg oct Bankof America
12 Global Equity Volatility Insights | 20 June 2017 Merrill Lynch
HOUSE_OVERSIGHT_014983
Document Preview

Click to view full size
Document Details
| Filename | HOUSE_OVERSIGHT_014983.jpg |
| File Size | 0.0 KB |
| OCR Confidence | 85.0% |
| Has Readable Text | Yes |
| Text Length | 2,132 characters |
| Indexed | 2026-02-04T16:24:22.488033 |