HOUSE_OVERSIGHT_014973.jpg
Extracted Text (OCR)
BofAML GFSI™ X-Asset Risk Landscape
Stress now below normal for all asset classes
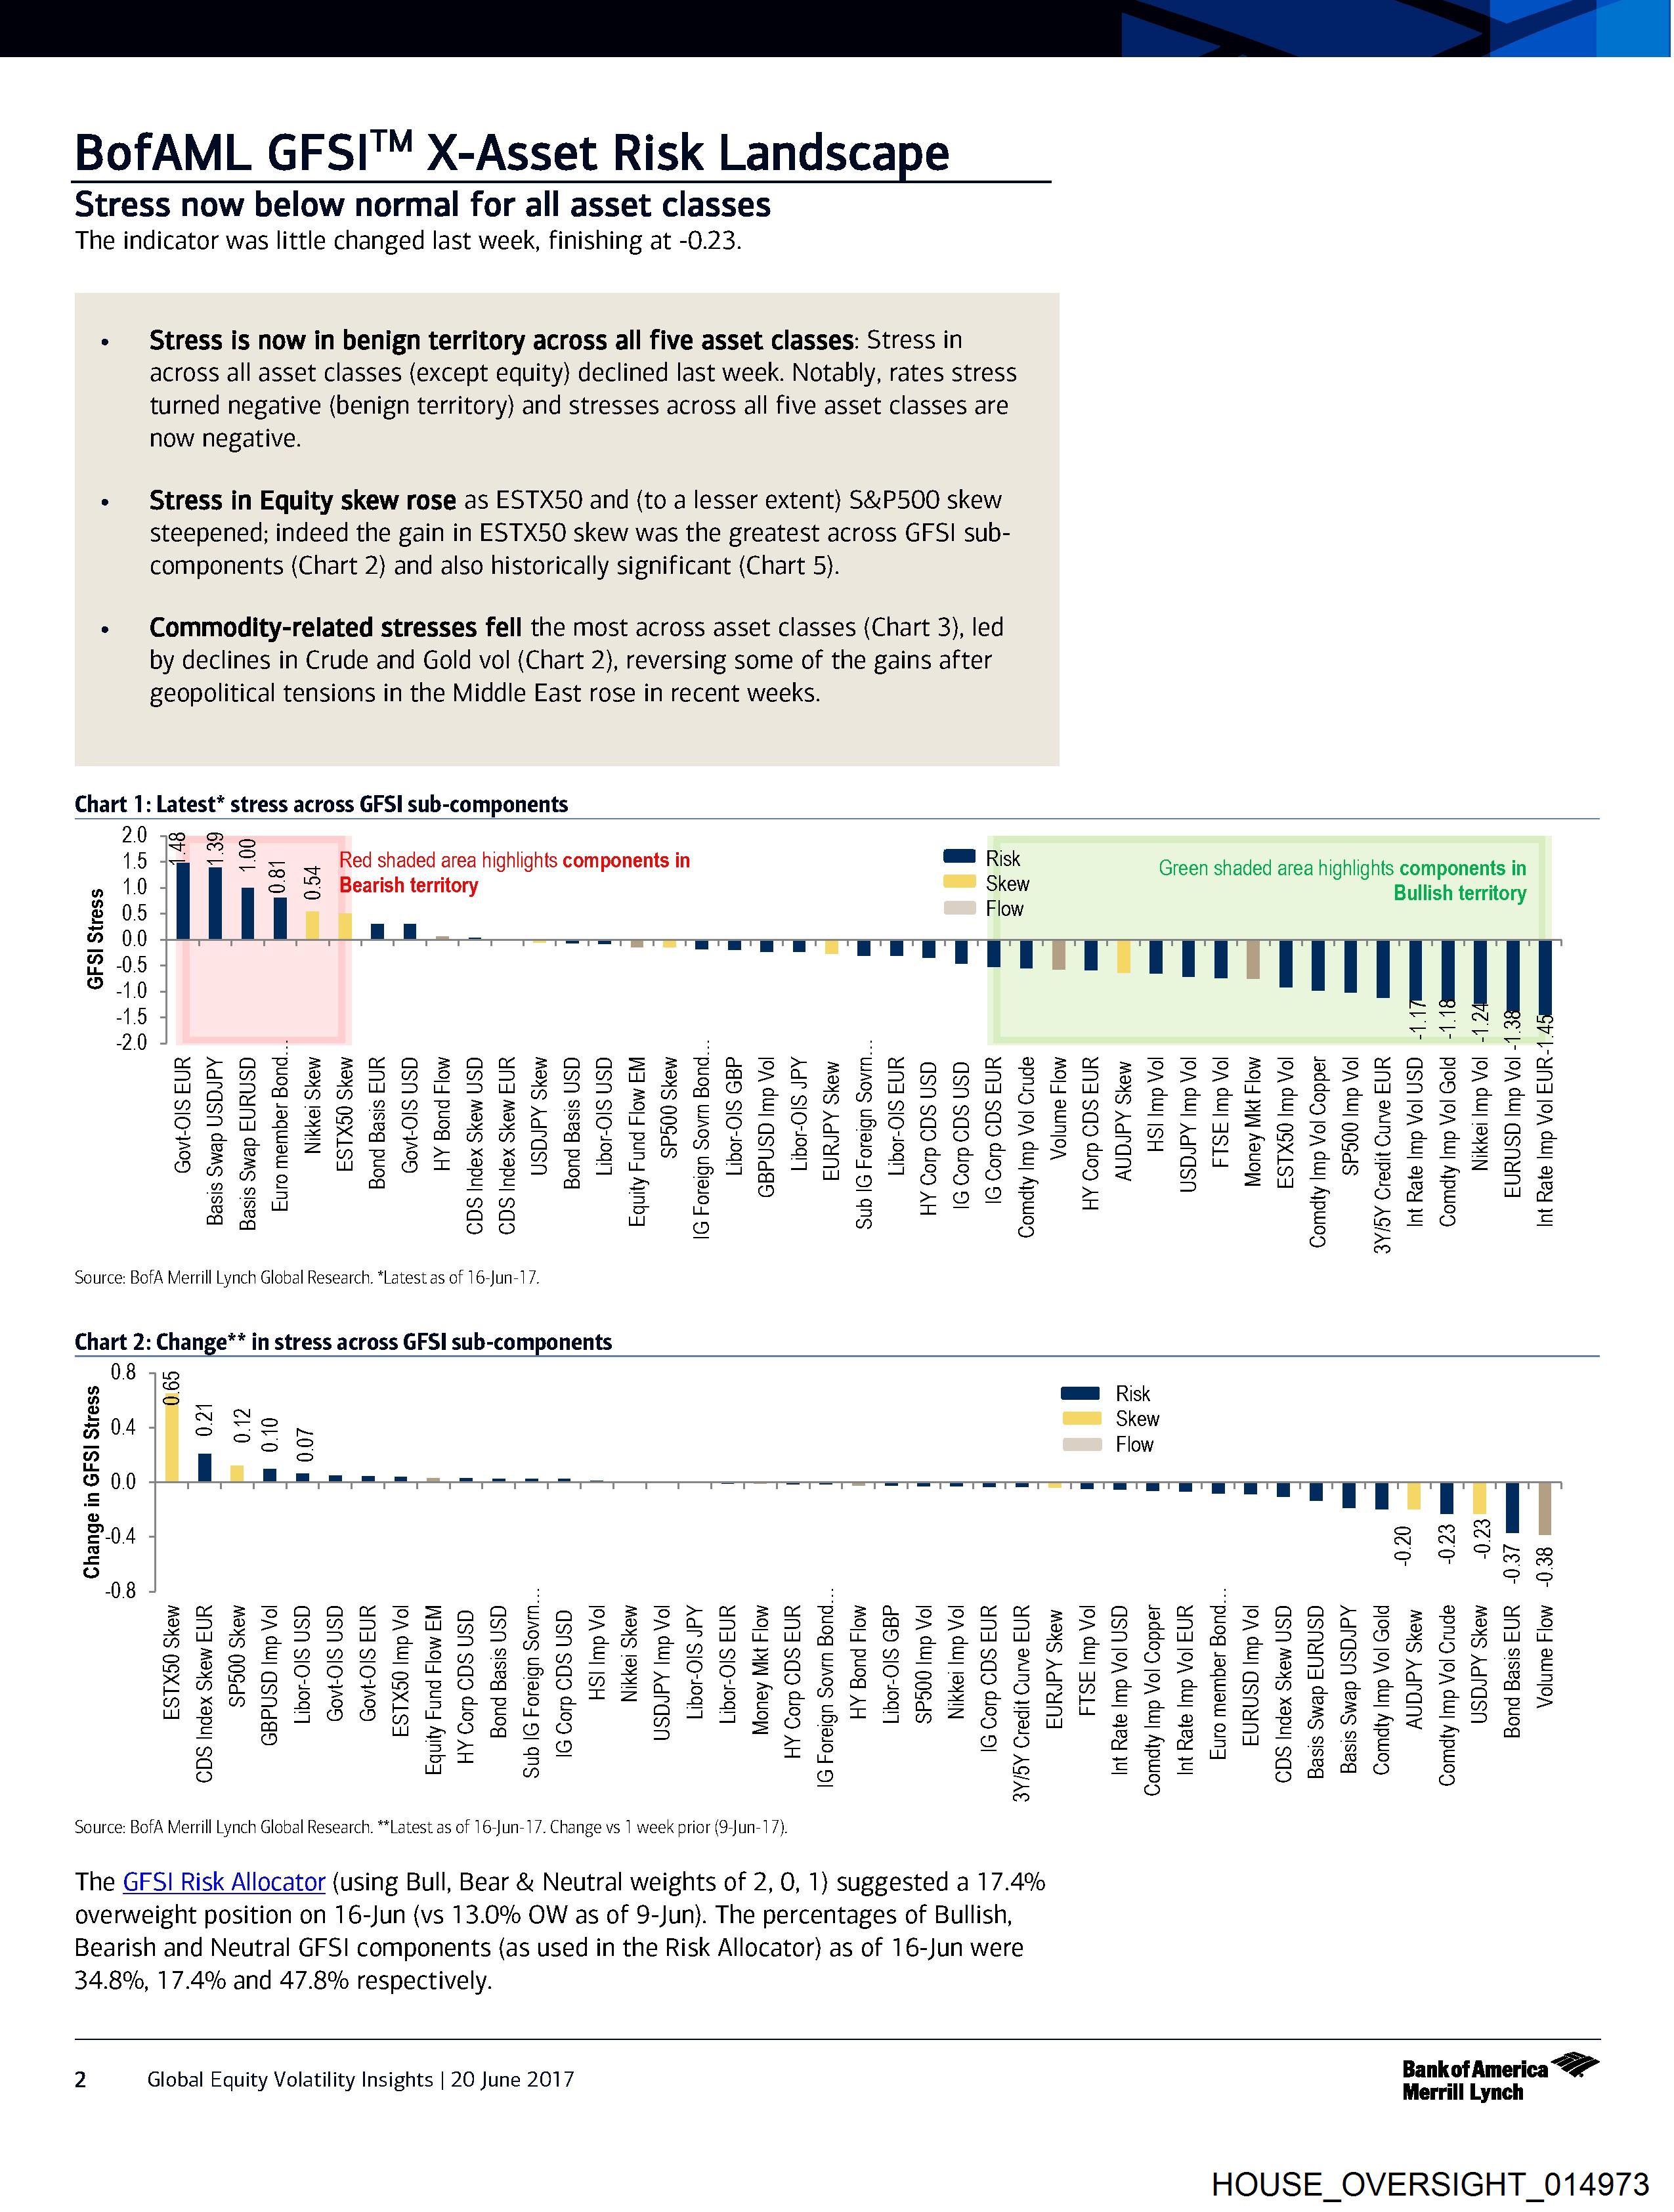
The indicator was little changed last week, finishing at -0.23.
¢ Stress is now in benign territory across all five asset classes: Stress in
across all asset classes (except equity) declined last week. Notably, rates stress
turned negative (benign territory) and stresses across all five asset classes are
now negative.
« Stress in Equity skew rose as ESTX50 and (to a lesser extent) S&P500 skew
steepened; indeed the gain in ESTX50 skew was the greatest across GFSI sub-
components (Chart 2) and also historically significant (Chart 5).
¢ Commodity-related stresses fell the most across asset classes (Chart 3), led
by declines in Crude and Gold vol (Chart 2}, reversing some of the gains after
geopolitical tensions in the Middle East rose in recent weeks.
Chart 1: Latest* stress across GFSI sub-components
2.0 12 Bo
15 me a == y Red shaded area highlights components in GS Risk Green shaded area highlights components in
» 1.0 so © Bearish territory “—* Skew Bullish territory
& 05 Flow
a 00 -
2 05
© 410
-1.5 4 mS es cs
erarg “ea ae aa BDaoor Ew ec ® ia oi rate npe
SEO SEES DEBS EBSBRSEEHSHE EES SSS SSS ESSSSEsResesHssss
UMeapawnntrbebouZFrrAszsnamaPaea GPRS GZtrSDSUSFtUSse oat easawrFso ou
ARS exp sSYREERS OHESERELL EPH FHRLPRPEEEXPESELSESEES
C2 eee BOS See BSCE S SCALE SORES SESE ZY wWZS8SES5 zzz aS
tae g eEtZtRaO#tDTHHVNA2eOLVARBGtinsae ft OO Rat SPaAa nH BF HSBPSSE 2 eSLFR Ba
6€ ae tH soe>xxAwvsBSEG” B S8@t& 682 an 822 eqatitsF ox ite) EEX Ee
8s e2eE OeezGEELRZL:2 ce S2@PFtP5 242 E25 € F 55 aust eozt-=szg-
CAG uweo caportrtoat aia 78 8ogs oma 2) 2nE”n 3 2 BS se
a 2 co £E co 2 2 © ane > 5 =u Fos - 3
Bas = 4 = > oO = os Ore Ww
es @w Ze fom 2 2 oa e <= = >= 8 =
oD
Source: BofA Merrill Lynch Global Research. *Latest as of 16-Jun-17.
Chart 2: Change** in stress across GFSI sub-components
0.8 y19 .
2 4 Gas Risk
o ~N N
B04 ss =e ~ “> Skew
= oe Flow
“td fo)
© 00 ™T a ee ee a a ee os se ee ae ee ee os i
re rrvTTTTT
ine]
P04 gaan
= oe FR Ss
(s) S656
08 ; ; ;
ia saaks a =e i) ore eso asnonoee ease Psoeaogar?rs ® [a4
BS ESBBSSHBABESS ESE, ESS eGE SSS SEER RES ELSSRESBESSESS
Au AFeaer- Messer -FZ<SeHFf eSGfteusat_ COeaeatosear- Frage er rpg ZS5GHUE
SESEHHHRESHPSEHREZFELZLVEREPMEERGLESSSERZSERS RSLS eB
22S8n900 Cet a gana Ss, P0OfRG B80 e 7, SBS uz aozen La -F=egesagsg
Hern LE #te#eeoEovOmM DORMXEA 5 Le Satis 2 Onadane2z#se2E6EQ97MN Ql 25 ans
AxGHDSSSKSeavsetrtzAnassgsee®s SPxBerTrerERgEsSS xe FSEaeRsu
mus "rr f#38 8h er Ss §t 5 AASSS8SEtTIAGZSZRAt* eEetEXe Ss eER2=EBE
f= a mpomAao 5 = ‘p £ Sea see De? ans >” «a
g © 22 290 = 2 a SeeCua"e2e¢es5 =F
a om ral ral ao 8
O uw a 2) ee £Ee ga ao 8
1S) > 8
foe]
Source: BofA Merrill Lynch Global Research. **Latest as of 16-Jun-17. Change vs 1 week prior (9-Jun-17).
The GFSI Risk Allocator (using Bull, Bear & Neutral weights of 2, 0, 1} suggested a 17.4%
overweight position on 16-Jun (vs 13.0% OW as of 9-Jun}. The percentages of Bullish,
Bearish and Neutral GFSI components (as used in the Risk Allocator) as of 16-Jun were
34.8%, 17.4% and 47.8% respectively.
Z Global Equity Volatility Insights | 20 June 2017 oat a
HOUSE_OVERSIGHT_014973
Document Preview

Click to view full size
Document Details
| Filename | HOUSE_OVERSIGHT_014973.jpg |
| File Size | 0.0 KB |
| OCR Confidence | 85.0% |
| Has Readable Text | Yes |
| Text Length | 3,201 characters |
| Indexed | 2026-02-04T16:24:22.629241 |