HOUSE_OVERSIGHT_014986.jpg
Extracted Text (OCR)
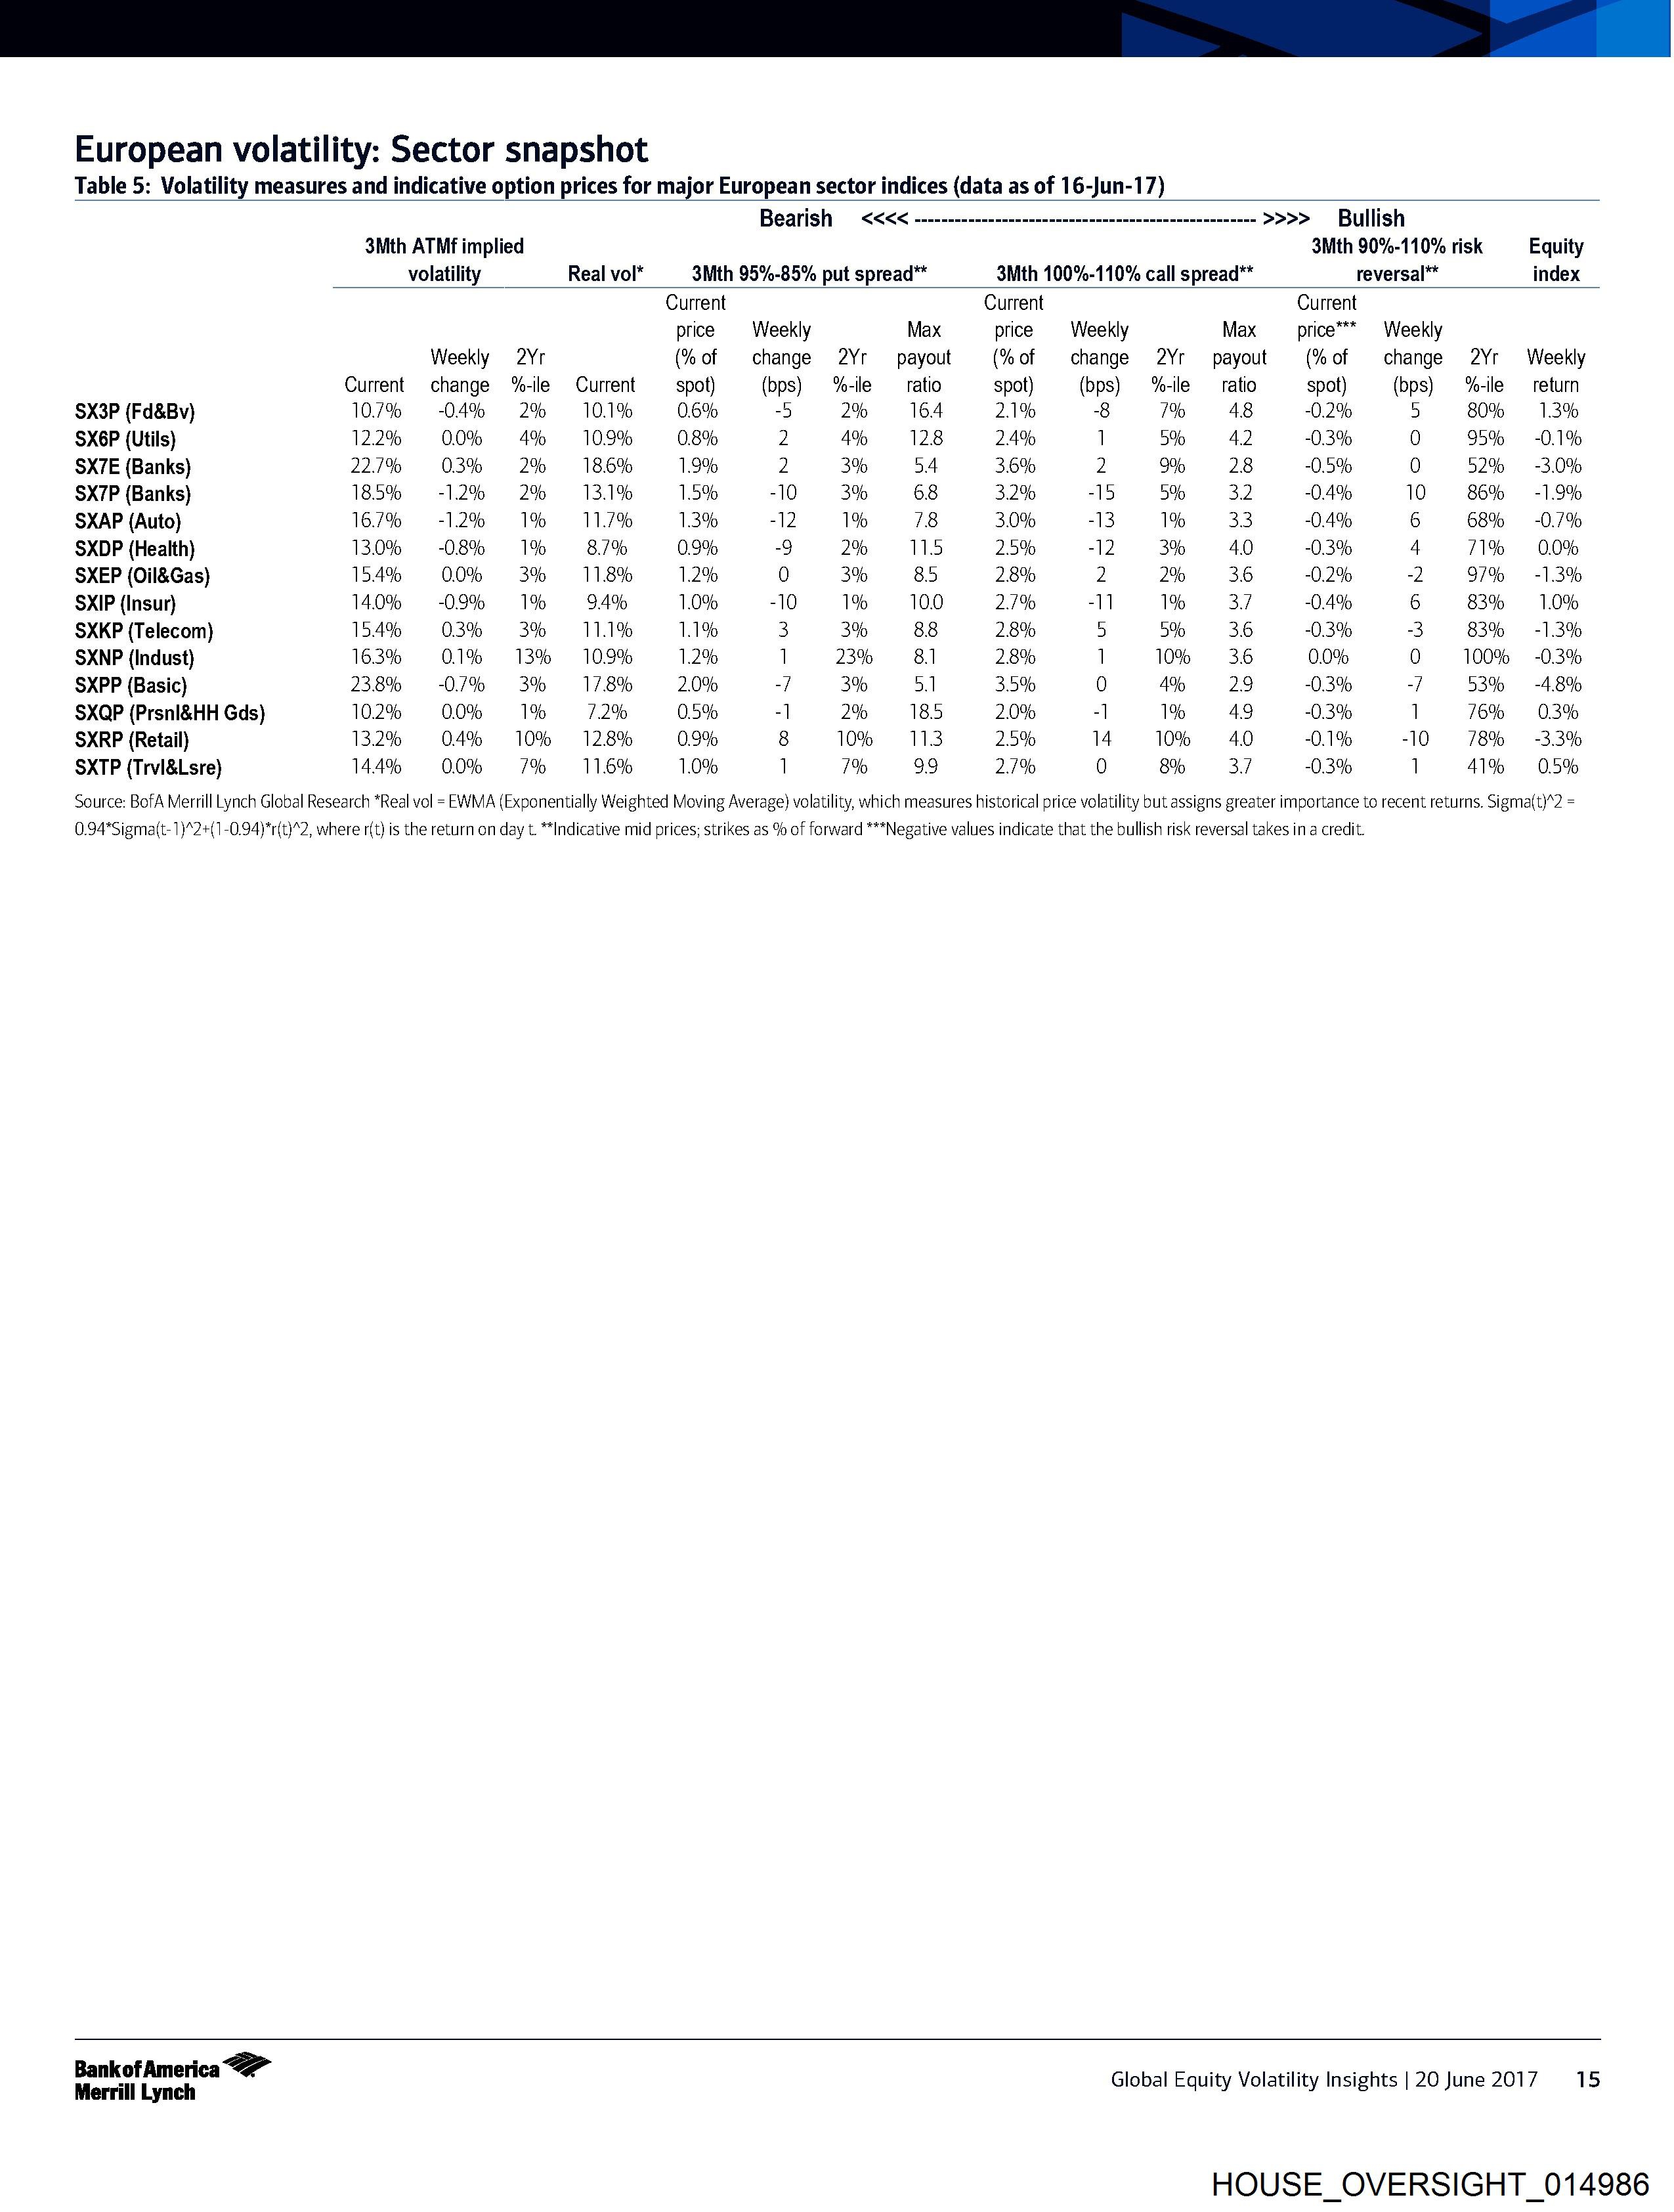
European volatility: Sector snapshot
Table 5: Volatility measures and indicative option prices for major European sector indices (data as of 16-Jun-17)
Bearish — <<<< ---------------------cccnneeccnenncccnennccnnnnes >>>> Bullish
3Mth ATMf implied 3Mth 90%-110% risk Equity
volatility Real vol* 3Mth 95%-85% put spread 3Mth 100%-110% call spread** reversal** index
Current Current Current
price Weekly Max price Weekly Max price™* Weekly
Weekly 2Yr (%of change 2Yr payout (%of change 2Yr payout (%of change 2Yr Weekly
Current change %-ile Current spot) (bps) %-ile ratio spot) (bps) %-ile — ratio spot) (bps) %-ile — return
SX3P (Fd&Bv) 0.7% -04% 2% 0.1% 0.6% = 2% 16.4 2.1% -8 7% 48 -0.2% 5 80% 13%
SX6P (Utils) 22% 0.0% 4% 0.9% 0.8% 2 4% 128 24% 5% 42 0.3% 0 95% = -0.1%
SX7E (Banks) 227% 0.3% 2% 8.6% 9% 2 3% 54 3.6% 2 9% 28 -0.5% 0 52% — -3.0%
$X7P (Banks) 85% -12% 2% 3.1% 5% -10 3% 68 3.2% =15 5% 3.2 -0.4% 10 86% = -1.9%
SXAP {Auto} 67% -12% 1% 1.7% 3% -12 1% 78 3.0% -13 % 33 -0.4% 6 68% -0./%
SXDP (Health) 3.0% -08% 1% 8.7% 0.9% 9 2% 115 2.5% -12 3% 40 -0.3% 4 71% 0.0%
SXEP (Oil&Gas) 5.4% 0.0% 3% 1.8% 2% 0 3% 85 2.8% 2 2% 3.6 -0.2% -2 97% = -1.3%
SXIP (Insur} 4.0% -0.9% 1% 9.4% 0% -10 1% 10.0 2.7% -11 % 37 0.4% 6 83% 1.0%
SXKP (Telecom) 54% 03% 3% 1.1% 1% 3 3% 88 2.8% 5 5% 3.6 -0.3% 3 83% — -1.3%
SXNP (Indust) 63% 01% 13% 0.9% 2% 23% 81 2.8% 10% 36 0.0% 0 100% — -0.3%
SXPP (Basic) 23.8% -0.7% 3% 7.8% 2.0% 7 3% 5.1 3.5% 0 4% 29 -0.3% -/ 53% — -4.8%
SXQP (Prsnl&HH Gds) 02% 0.0% 1% 7.2% 0.5% -] 2% 185 2.0% -] % 49 -~0.3% 1 76% 0.3%
SXRP (Retail) 3.2% 0.4% 10% 2.8% 0.9% 8 10% 113 2.5% 14 10% 40 -0.1% -10 = 78% = -3.3%
SXTP (Trvl&Lsre) 44% 0.0% 7% 1.6% 0% 7% 9.9 2.7% 0 8% 37 -0.3% 1 41% 05%
Source: BofA Merrill Lynch Global Research *Real vol = EWMA (Exponentially Weighted Moving Average) volatility, which measures historical price volatility but assigns greater importance to recent returns. Sigma(t)*2 =
0.94*Sigma(t- 1)*2+(1-0.94)*r(t}*2, where r(t) is the return on day t. “Indicative mid prices; strikes as % of forward ***Negative values indicate that the bullish risk reversal takes in a credit.
Bankof America <> ’ arietive
Merrill Lynch Global Equity Volatility Insights | 20 June 2017 15
HOUSE_OVERSIGHT_014986
Document Preview

Click to view full size
Document Details
| Filename | HOUSE_OVERSIGHT_014986.jpg |
| File Size | 0.0 KB |
| OCR Confidence | 85.0% |
| Has Readable Text | Yes |
| Text Length | 2,258 characters |
| Indexed | 2026-02-04T16:24:23.594941 |