HOUSE_OVERSIGHT_020874.jpg
Extracted Text (OCR)
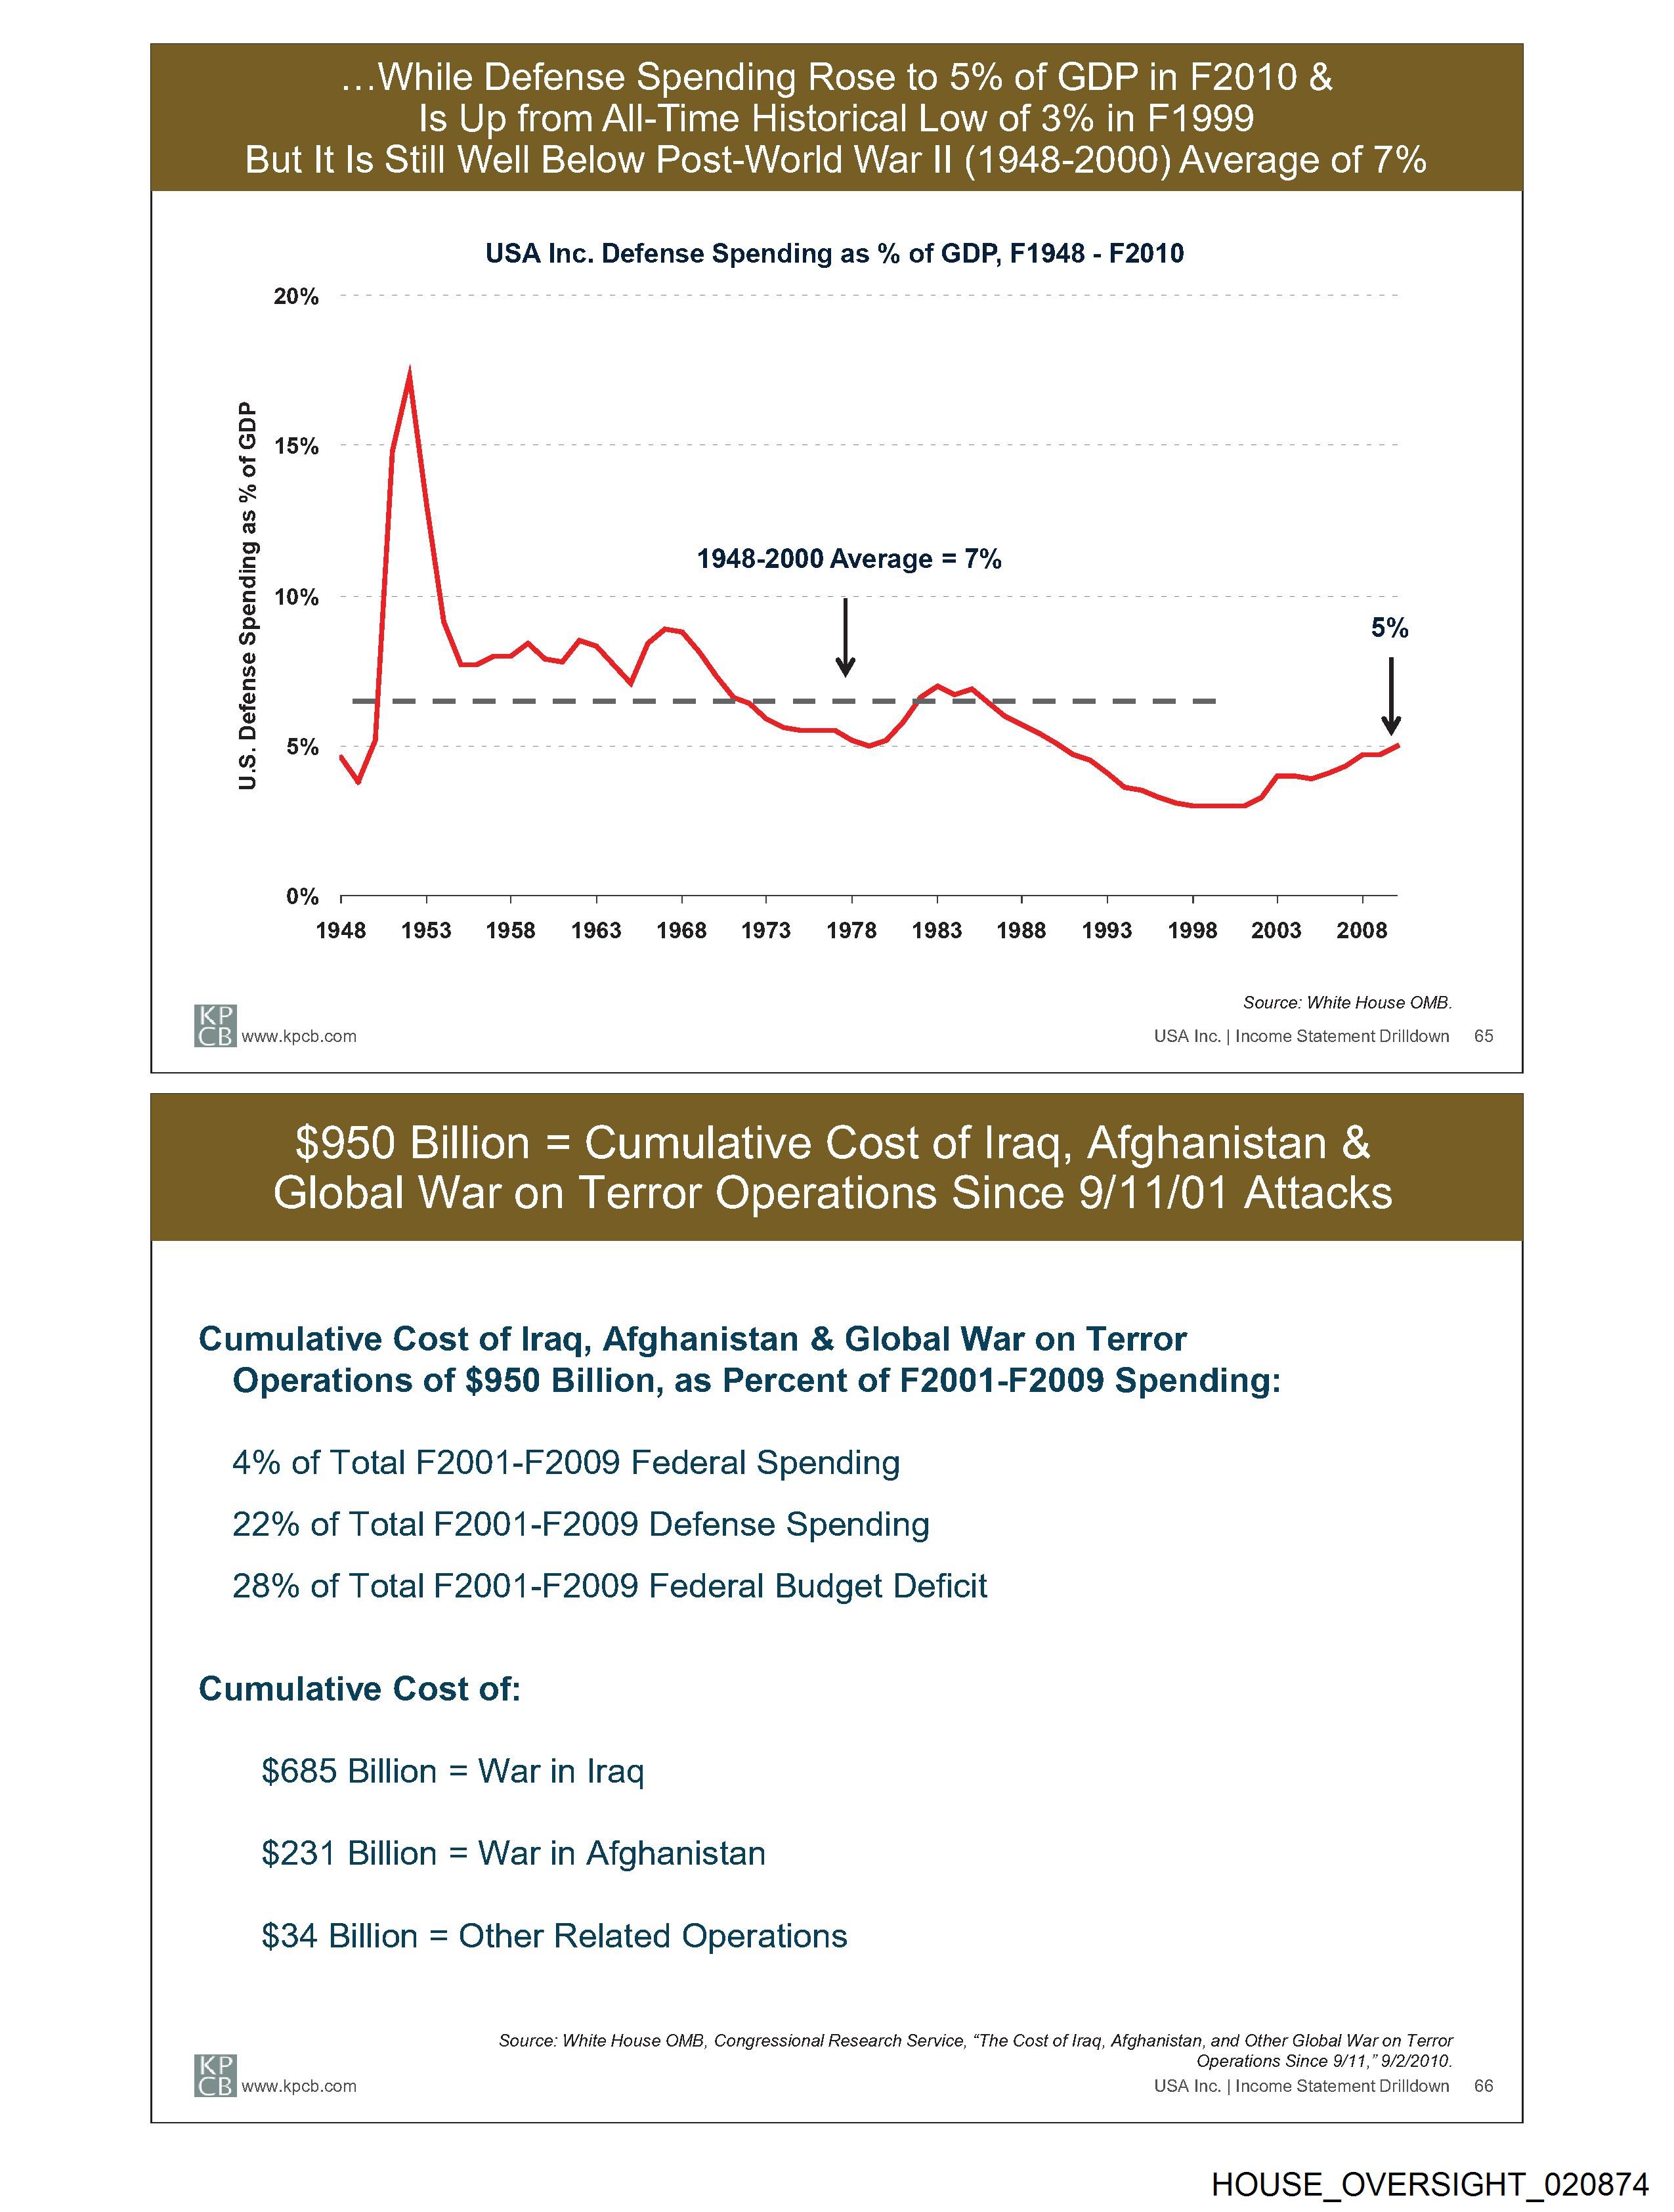
...While Defense Spending Rose to 5% of GDP in F2010 &
Is Up from All-Time Historical Low of 3% in F1999
But It Is Still Well Below Post-World War II (1948-2000) Average of 7%
USA Inc. Defense Spending as % of GDP, F1948 - F2010
SEO Gig = mem ee on re mee ca 2 set = rn Se = on a = eH Ht SR = oh tt Gy = mu on S
a
a
O 15% fn
°
SS
2)
[o>]
2 1948-2000 Average = 7%
2 10% ---|---}-------------------- 2-22-2222 penne nn eee
& | 5%
%
<
ee ee
g
NS a
2
0% 1 T T T T T T T T T T T T
1948 1953 1958 1963 1968 1973 1978 1983 1988 1993 1998 2003 2008
KP Source: White House OMB.
BSF owe poo com USA Inc. | Income Statement Drilldown 65
$950 Billion = Cumulative Cost of Iraq, Afghanistan &
Global War on Terror Operations Since 9/11/01 Attacks
Cumulative Cost of Iraq, Afghanistan & Global War on Terror
Operations of $950 Billion, as Percent of F2001-F2009 Spending:
4% of Total F2001-F2009 Federal Spending
22% of Total F2001-F2009 Defense Spending
28% of Total F2001-F2009 Federal Budget Deficit
Cumulative Cost of:
$685 Billion = War in Iraq
$231 Billion = War in Afghanistan
$34 Billion = Other Related Operations
Source: White House OMB, Congressional Research Service, “The Cost of lraq, Afghanistan, and Other Global War on Terror
K Pp Operations Since 9/11,” 9/2/2010.
(@ EB) www.kpcb.com USA Inc. | Income Statement Drilldown 66
HOUSE_OVERSIGHT_020874
