HOUSE_OVERSIGHT_020869.jpg
Extracted Text (OCR)
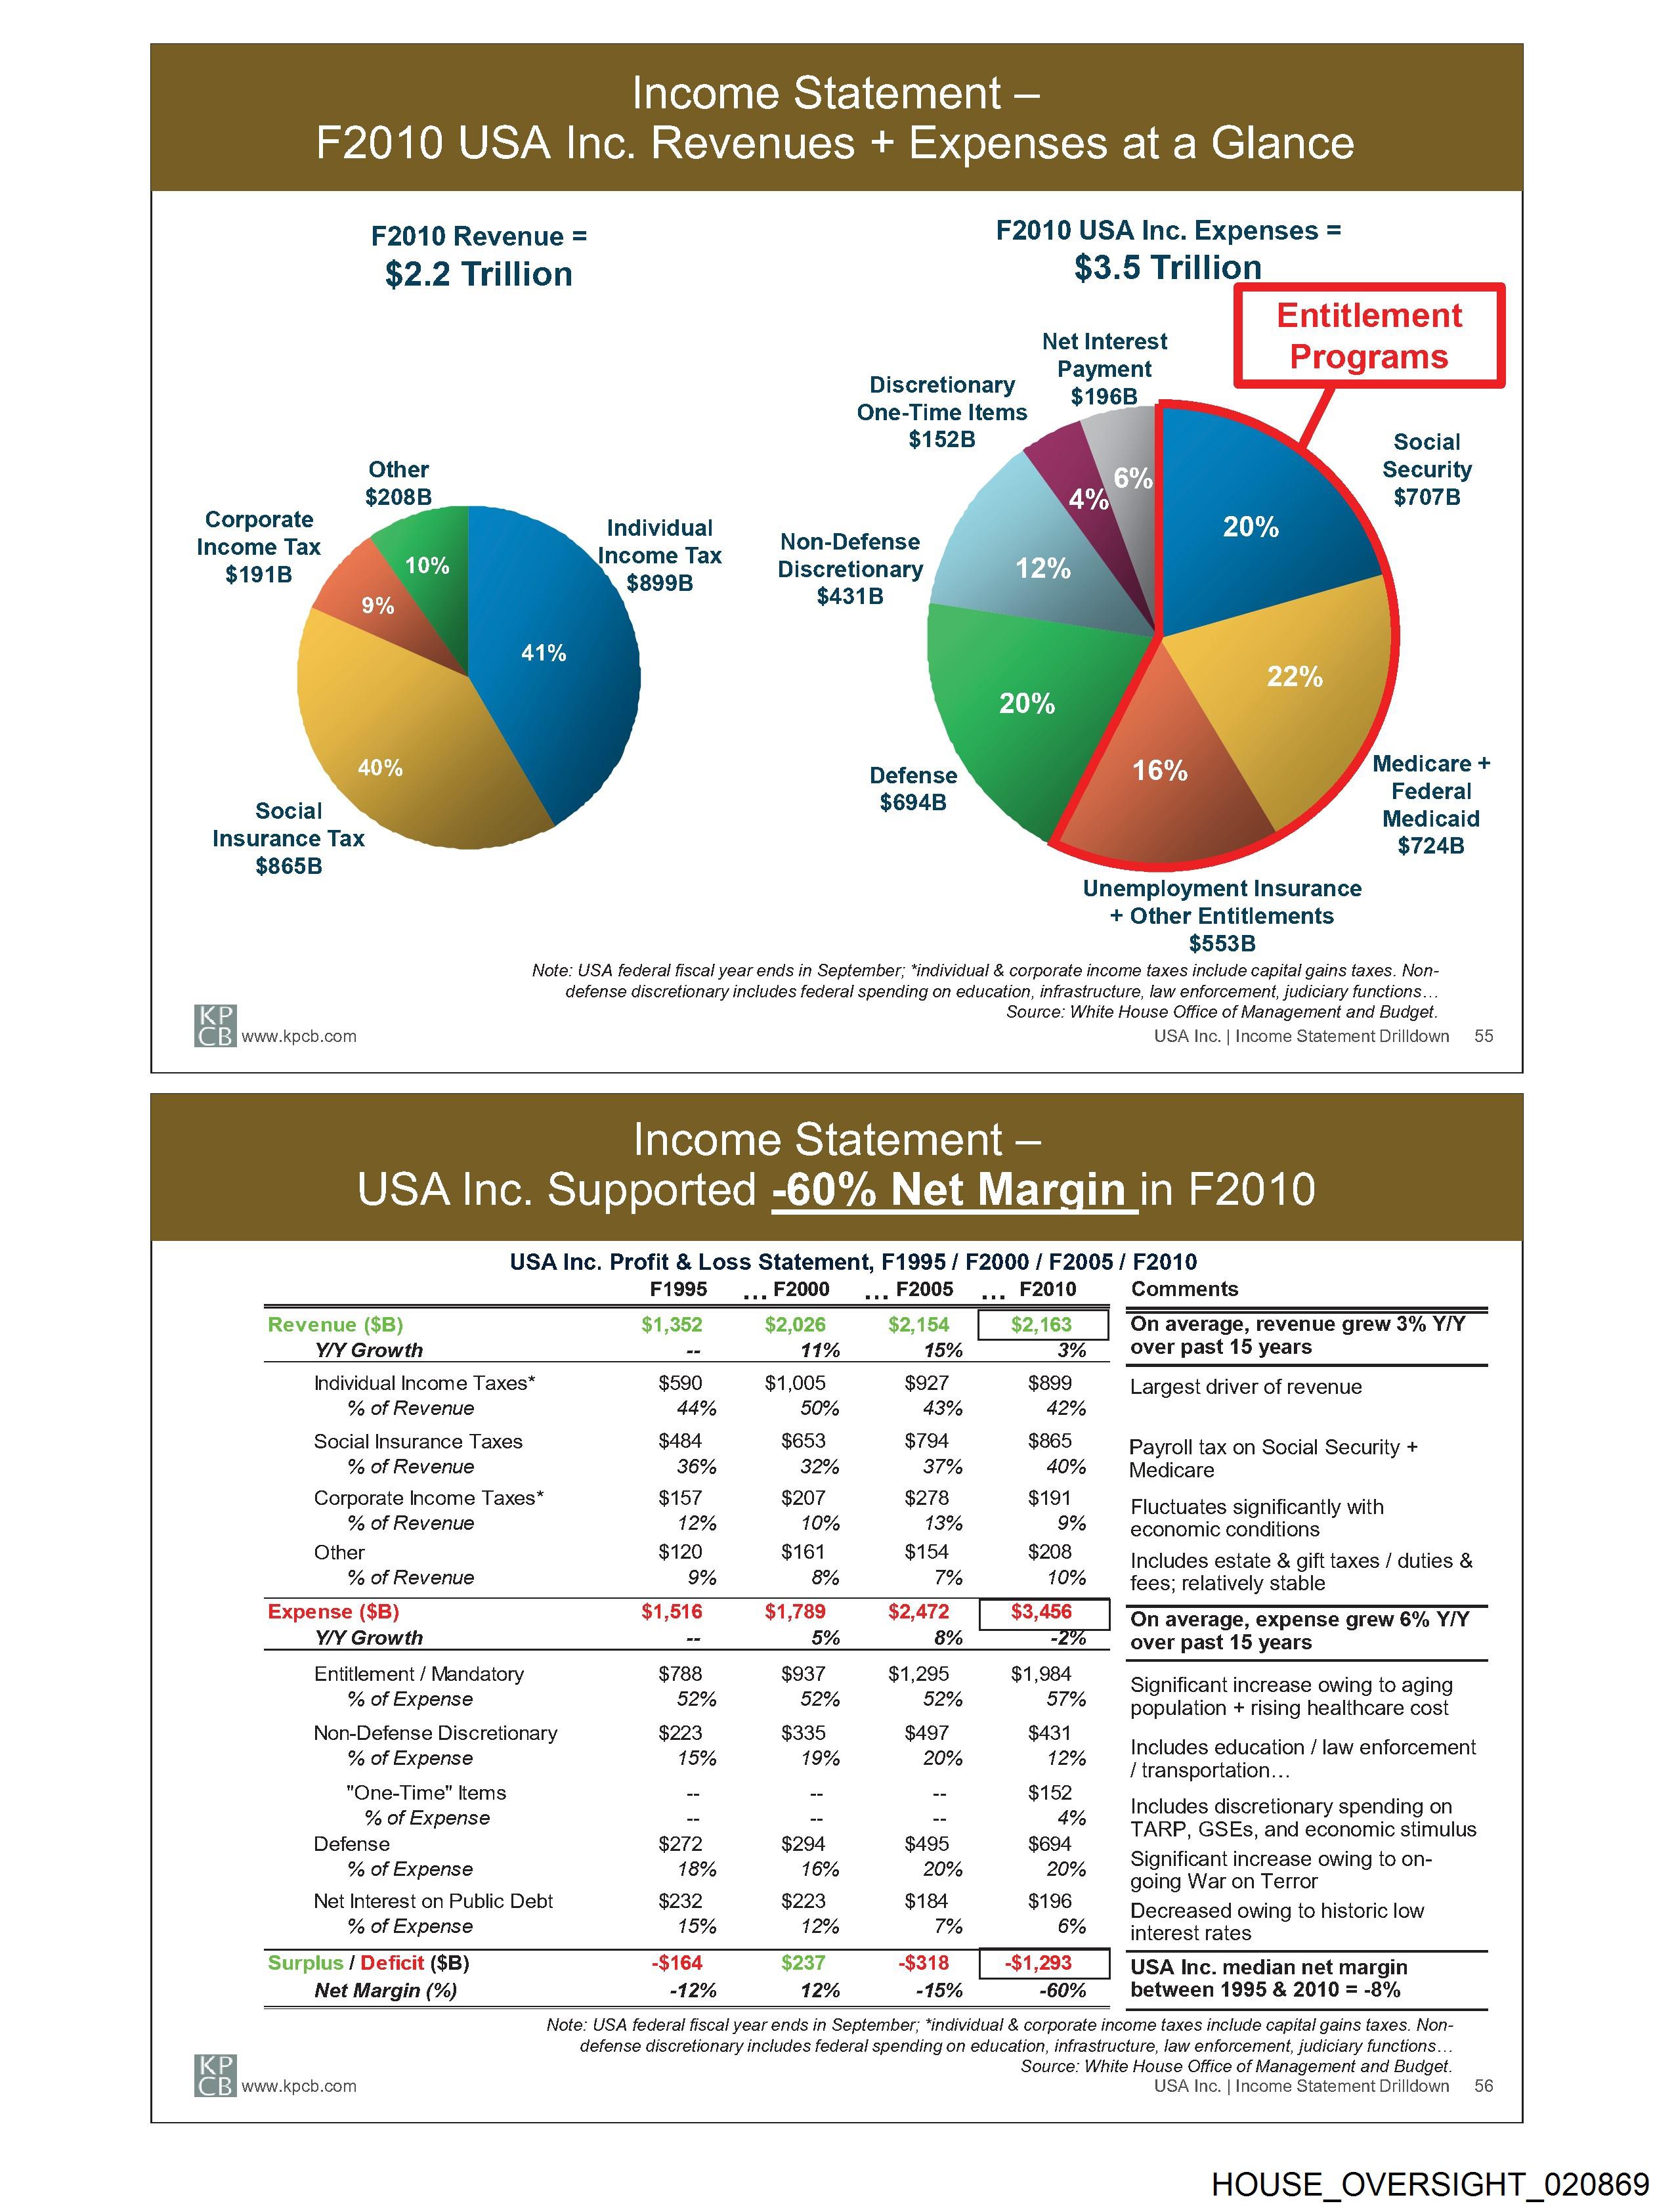
Income Statement —
F2010 USA Inc. Revenues + Expenses at a Glance
F2010 Revenue = F2010 USA Inc. Expenses =
$2.2 Trillion $3.5 Trillion
Entitlement
Programs
Net Interest
Payment
$196B_
Discretionary
One-Time Items
$152B Social
Security
$707B
Other
$208B
Corporate Individual
Income Tax Income Tax Nor Defense
$191B $899B meres
Defense gece Ee
i 694B
Social $ Medicaid
Insurance Tax $724B
$865B
Unemployment Insurance
+ Other Entitlements
$553B
Note: USA federal fiscal year ends in September; *individual & corporate income taxes include capital gains taxes. Non-
defense discretionary includes federal spending on education, infrastructure, law enforcement, judiciary functions...
KP Source: White House Office of Management and Budget.
BSF owe poo com USA Inc. | Income Statement Drilldown 55
Income Statement —
USA Inc. Supported -60% Net Margin in F2010
USA Inc. Profit & Loss Statement, F1995 / F2000 / F2005 / F2010
F1995 .., £2000 ..,F2005 ._,, F2010 Comments
Revenue ($B) $1,352 $2,026 $2,154 On average, revenue grew 3% Y/Y
Y/Y Growth - 11% 15% 3% over past 15 years
Individual Income Taxes* $590 $1,005 $927 $899 Largest driver of revenue
% of Revenue 44% 50% 43% 42%
Social Insurance Taxes $484 $653 $794 $865 Payroll tax on Social Security +
% of Revenue 36% 32% 37% 40% Medicare
Corporate Income Taxes* $157 $207 $278 $191 Fluctuates significantly with
% of Revenue 12% 10% 13% 9% economic conditions
Other $120 $161 $154 $208 Includes estate & gift taxes / duties &
% of Revenue 9% 8% 7% 10% fees; relatively stable
Expense ($B) $1,516 $1,789 $2,472 $3,456 "On average, expense grew 6% YIY
Y/Y Growth = 5% 8% -2% over past 15 years
Entitlement / Mandatory $788 $937" $1,295, $1 884 Significant increase owing to aging
% of Expense 52% 52% Dat 97% population + rising healthcare cost
Non-Defense Discretionary $223 $335 $497 $431 Tel seater dE | fi t
% of Expense 15% 19% 20% 12% ncludes education / law enforcemen
/ transportation...
ene Wie tems ~ ~ ~ wiles Includes discretionary spending on
% of Expense ~ ~ ~ 4% TARP, GSEs, and economic stimulus
Defense $272 $294 $495 $604 Siani fi ti : ina t
% of Expense 18% 16% 20% 20% ignificant increase owing to on-
going War on Terror
Net Interest on Public Debt $232 $223 $184 $196 Decreased owing to historic low
% of Expense 15% 12% 7% 6% interest rates
Surplus / Deficit ($B) -$164 $237 -$318 [_ $1,293 | USA Inc. median net margin
Net Margin (%) -12% 12% -15% 60% between 1995 & 2010 = -8%
Note: USA federal fiscal year ends in September; *individual & corporate income taxes include capital gains taxes. Non-
defense discretionary includes federal spending on education, infrastructure, law enforcement, judiciary functions...
KP Source: White House Office of Management and Budget.
(@ EB) www.kpcb.com USA Inc. | Income Statement Drilldown 56
HOUSE_OVERSIGHT_020869
Document Preview

Click to view full size
Document Details
| Filename | HOUSE_OVERSIGHT_020869.jpg |
| File Size | 0.0 KB |
| OCR Confidence | 85.0% |
| Has Readable Text | Yes |
| Text Length | 2,854 characters |
| Indexed | 2026-02-04T16:42:53.309279 |