HOUSE_OVERSIGHT_023577.jpg
Extracted Text (OCR)
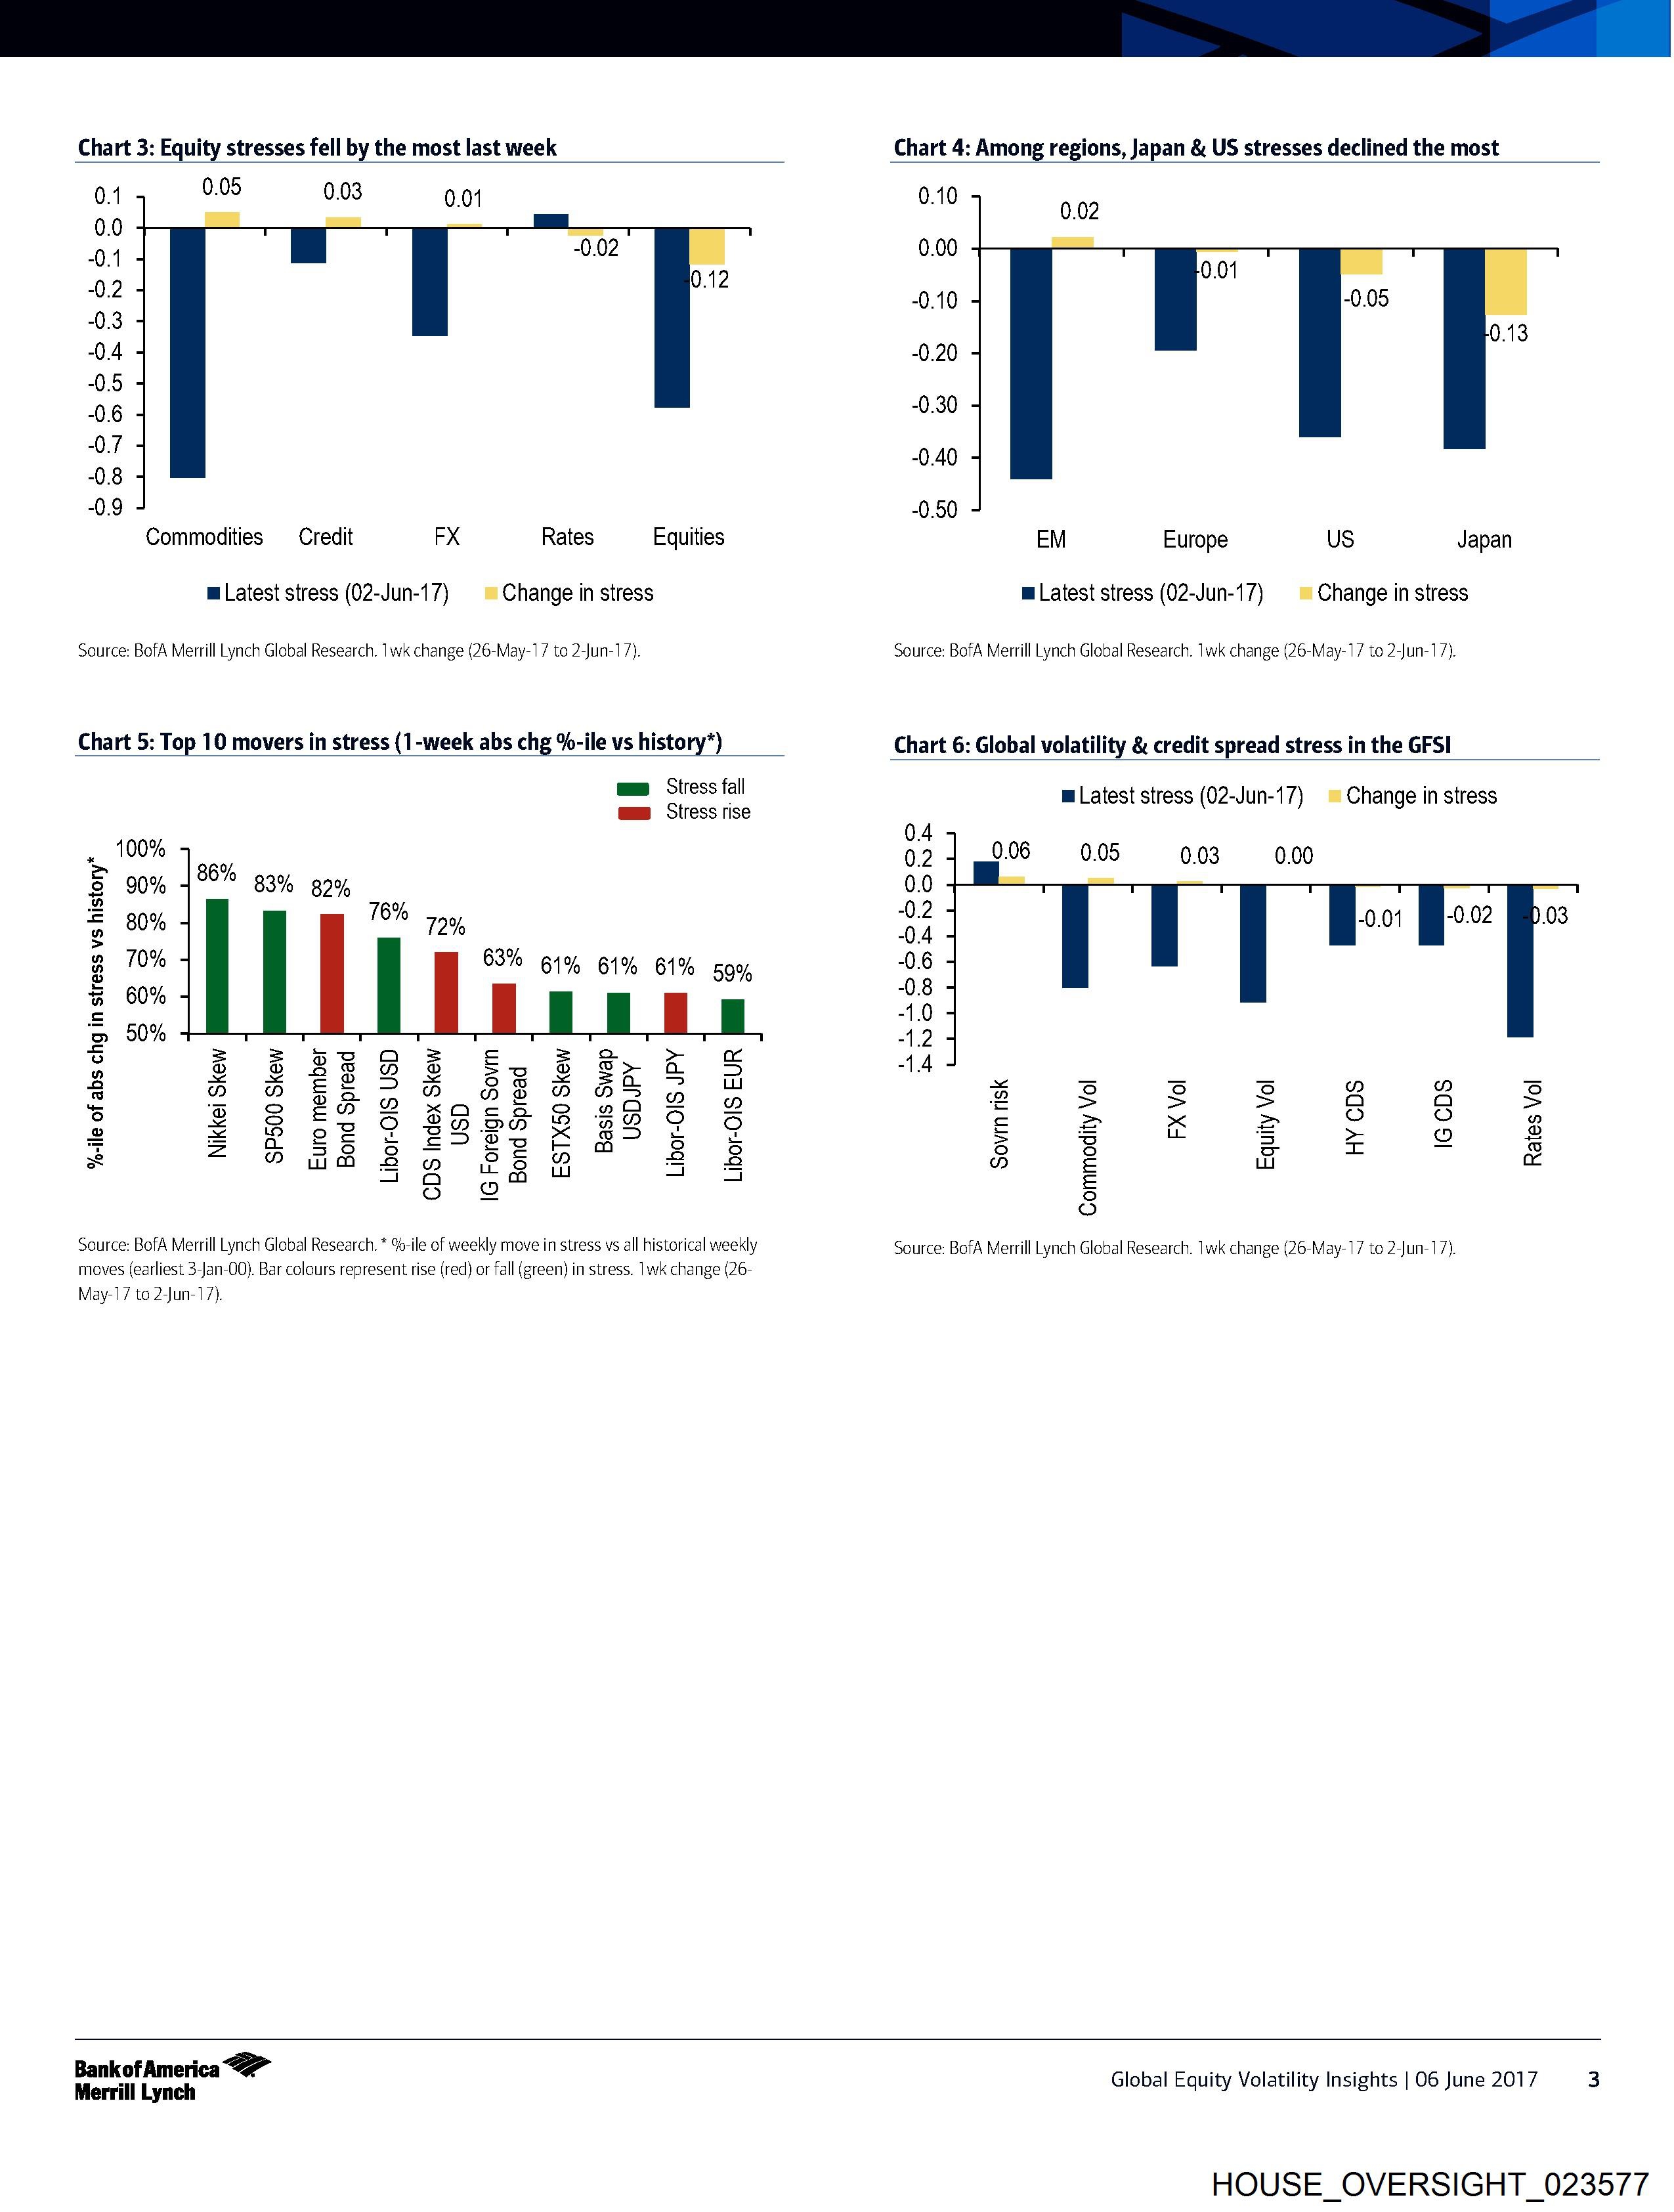
Chart 3: Equity stresses fell by the most last week
0.1 0.05 0.03 0.01
0.0
0.1
0.2
03
0.4
05
06
07
08
0.9
Commodities Credit FX Rates Equities
mLatest stress (02-Jun-17) | = Change in stress
Source: BofA Merrill Lynch Global Research. 1wk change (26-May-17 to 2-Jun-17).
Chart 5: Top 10 movers in stress (1-week abs chg %-ile vs history*)
Chart 4: Among regions, Japan & US stresses declined the most
gas Stress fall
@@s Stress rise
100%
90%
80%
70%
86% 33% 82%
Q,
76% 70,
63% 61% 61% 61% sg%
%-ile of abs chg in stress vs history*
60%
50%
or com Qa
$ 6 88 & & Ep 5 Sra SF
2 > oO >
5 6 E235 885 4h G
D es 2H 2 xneck 8B OAS ”
= Boe FG 8220 2 eS 2 9
Saes § E> eco FB -s FF
= © 78 Bo £5 & =
SQ og |
o 2
Source: BofA Merrill Lynch Global Research. * %-ile of weekly mave in stress vs all historical weekly
moves (earliest 3-Jan-00). Bar colours represent rise (red) or fall (green) in stress. 1wk change (26-
May-17 to 2-Jun-17).
0.10
0.00
-0.10
-0.20
-0.30
-0.40
-0.50
EM Europe US Japan
mLatest stress (02-Jun-17) © Change in stress
Source: BofA Merrill Lynch Global Research. 1wk change (26-May-17 to 2-Jun-17).
Chart 6: Global volatility & credit spread stress in the GFSI
mLatest stress (02-Jun-17) = Change in stress
0.4
0.2
0.0
-~0.2
0.4
-0.6
0.8
-1.0
-1.2
-1.4
0.05 0.03 0.00
FX Vol
HY CDS
IG CDS
Equity Vol
Rates Vol
x
pe)
=
cS
=
>
fo)
vp)
Commodity Vol
Source: BofA Merrill Lynch Global Research. 1wk change (26-May-17 to 2-Jun-17).
Bankof America
Merrill Lynch
Global Equity Volatility Insights | O06 June 2017 3
HOUSE_OVERSIGHT_023577
Document Preview

Click to view full size
Document Details
| Filename | HOUSE_OVERSIGHT_023577.jpg |
| File Size | 0.0 KB |
| OCR Confidence | 85.0% |
| Has Readable Text | Yes |
| Text Length | 1,583 characters |
| Indexed | 2026-02-04T16:51:24.174606 |