HOUSE_OVERSIGHT_023576.jpg
Extracted Text (OCR)
BofAML GFSI™ X-Asset Risk Landscape
GFSI below ‘normal’ for longest period since summer 2014
The GFSI continued its decline last week, falling to -0.21 as of 2-Jun from -0.17 a week
prior. The indicator last spent a significant proportion of time below -0.2 back in
summer 2014, when cross asset volatility recorded long term lows.
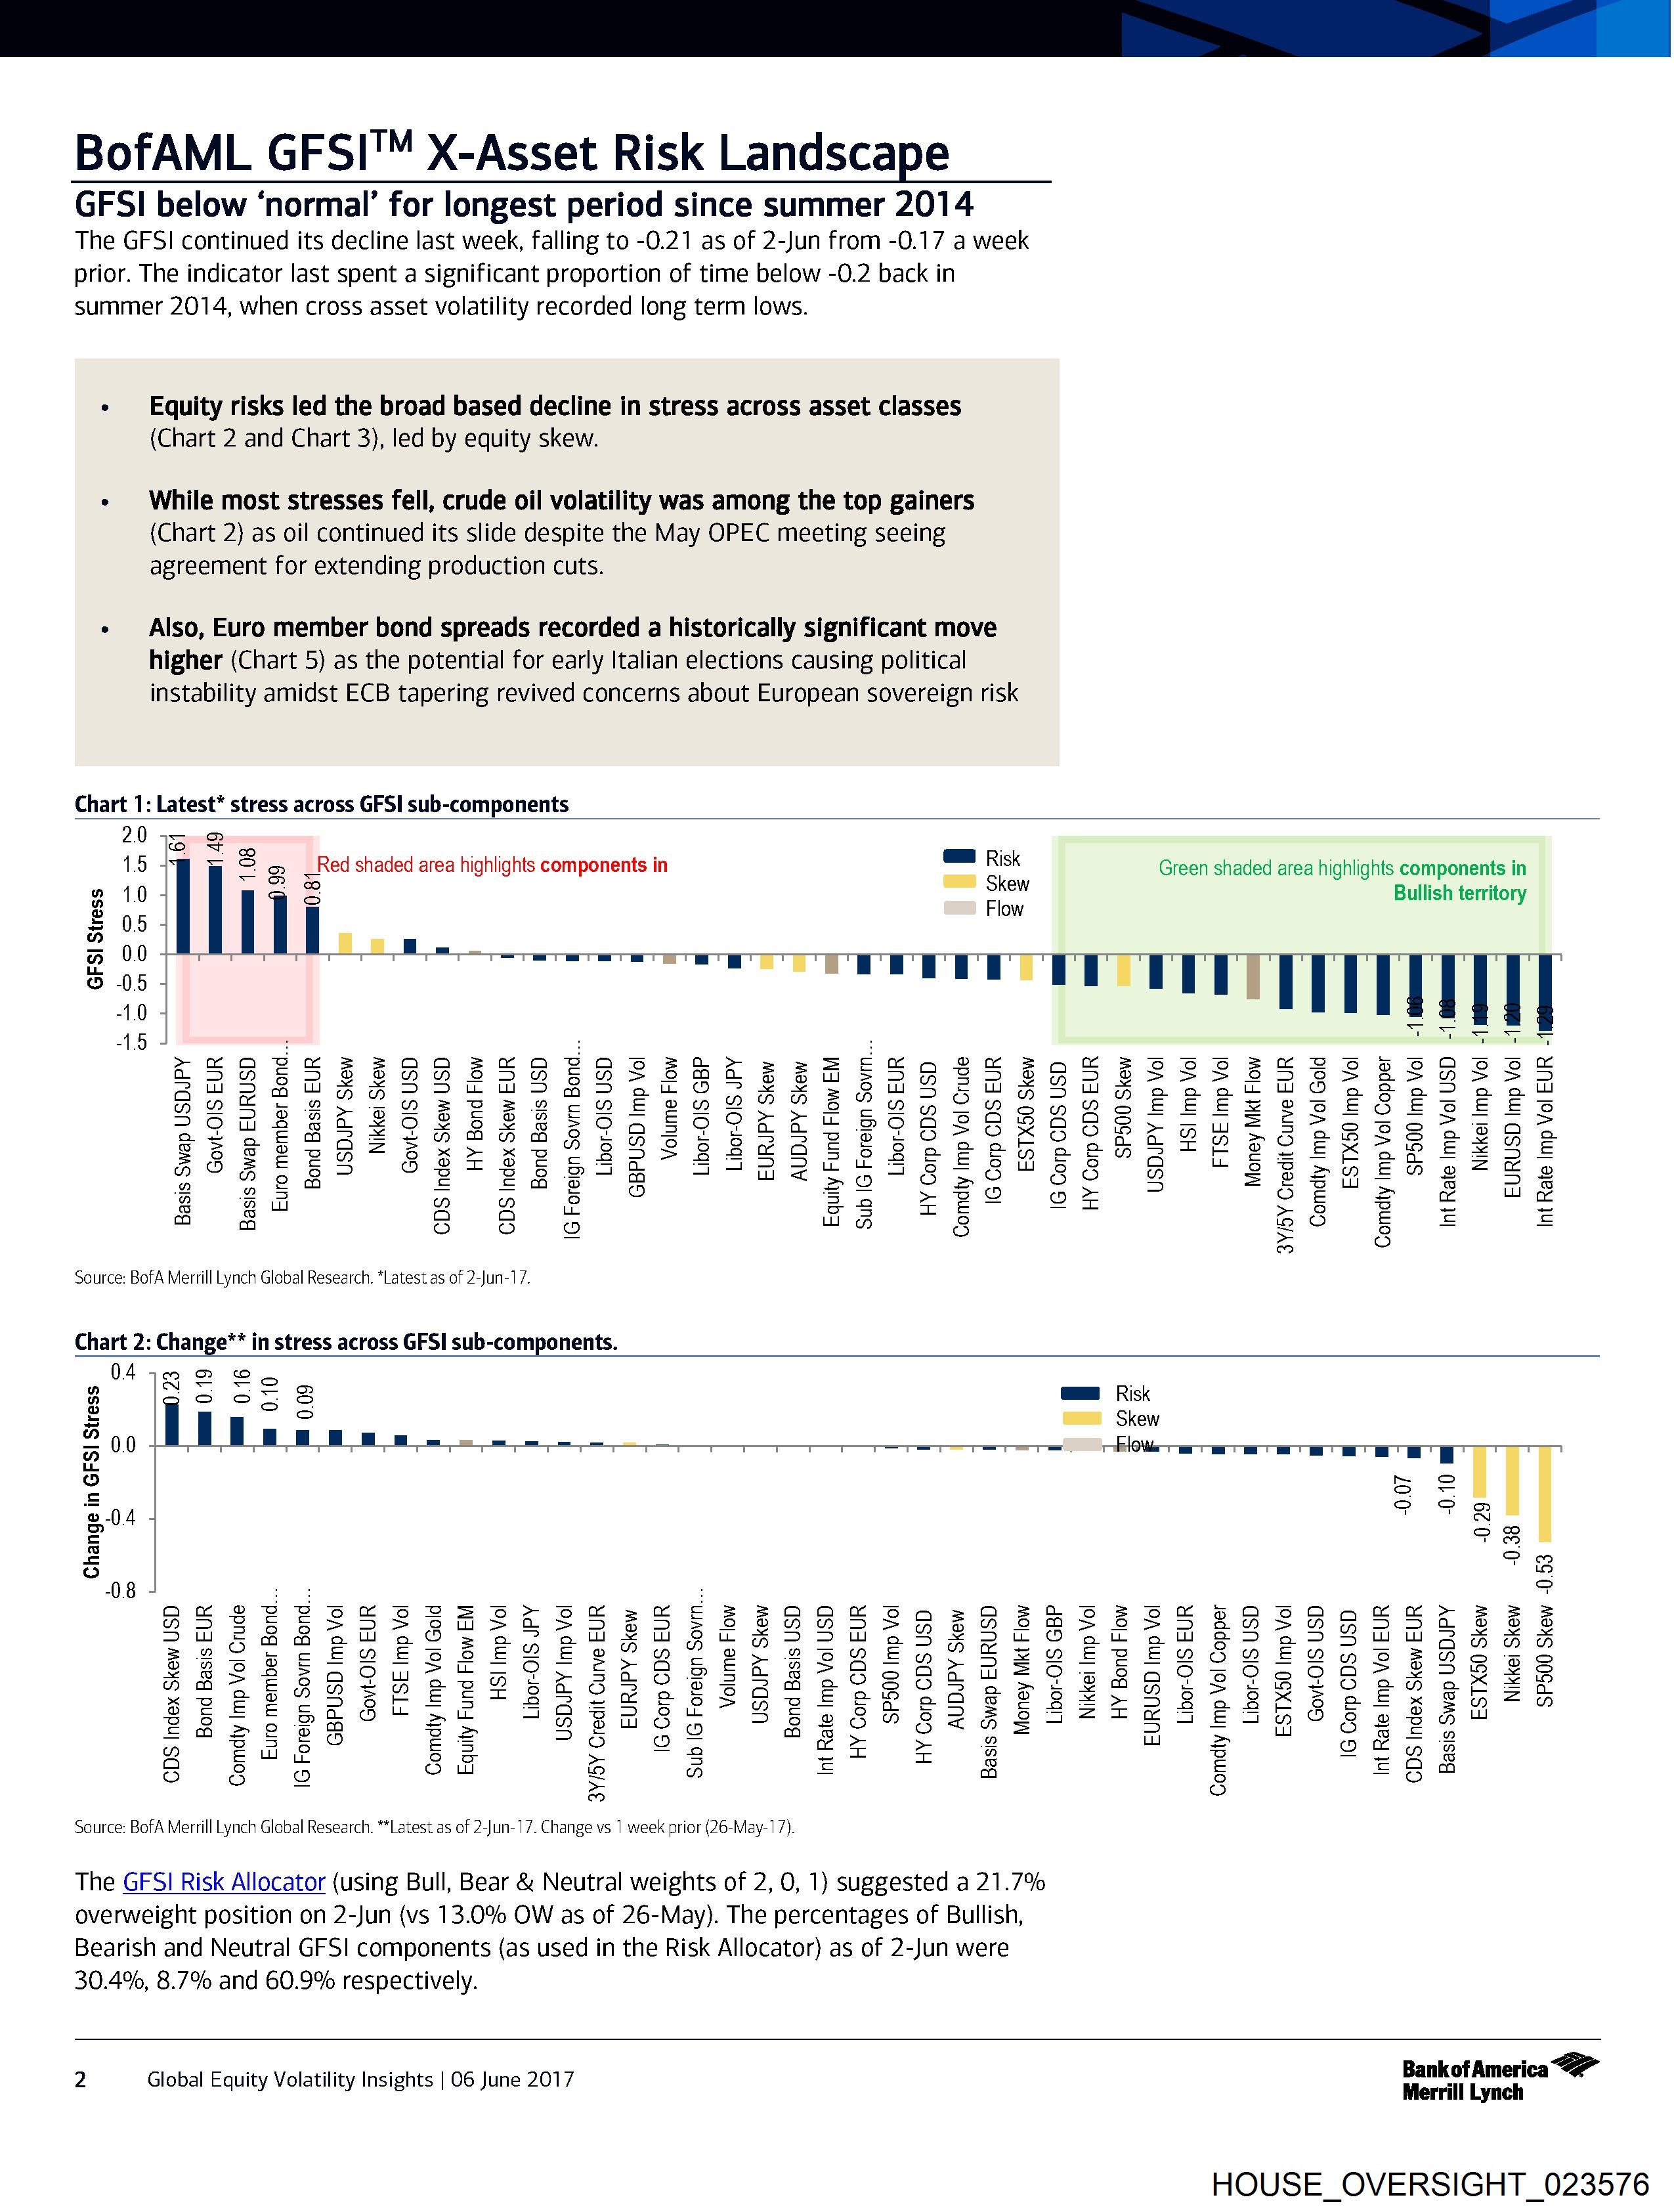
+ Equity risks led the broad based decline in stress across asset classes
(Chart 2 and Chart 3), led by equity skew.
¢ While most stresses fell, crude oil volatility was among the top gainers
(Chart 2) as oil continued its slide despite the May OPEC meeting seeing
agreement for extending production cuts.
« Also, Euro member bond spreads recorded a historically significant move
higher (Chart 5) as the potential for early Italian elections causing political
instability amidst ECB tapering revived concerns about European sovereign risk
Chart 1: Latest* stress across GFSI sub-components
2.0 5
1.5 4 2 2 _Red shaded area highlights components in = ak Green shaded area highlights components in
2 10 4 _ = Blew. Bullish territory
= 05
© 05 +
-1.0 2éeé
>eave aa erapras o> ce o x oc SBS erszsneunpSnBaS SEL
OTR EEE RR ESHRESBSEHSE EER ESR ES ESS SESESESSSRERESES
aAaMYrPatAHZ?-DPEYO mM et OTs K te SG4IDSGSFLDAYHZ eee bh Ue Ber ractt
RLAgGZ>~eVOREeEEZ eVEel2S rr FeclusBeseBsgEFLEETSeESOESEES
2Ome ee eOog ss see a soOleaes SPOsesscRe2oeser~njuzseagsgeresasa
See EDTA SPPTHODAZsSHRe ps se eet se ae EZtAPHRFOPRSFSEHBHE
$8 2Ba Sx XD BrP >see OR SB eo BAH BELG R =~ 2©®LTtE&EReaPEX SE
SSeE2EES ® @ tr oeecoco#E f®Fsaaf7ue £5 £Eet s 8 a “5 e535,5 2 Sr
Ao B Ee ESPta AT Tee zao 7S SB°° EO B@ SseFztntre2e" 52
n 2¢ a £ £ oO oo amv eas =) - co Ww oO oO
B 23 3 © = > so oz Og = « Wo
g gw & @ pe os 8 am & =x > 6 z = =
foe]
Source: BofA Merrill Lynch Global Research. *Latest as of 2-Jun-17.
Chart 2: Change** in stress across GFSI sub-components.
W499 2 Lo ;
a a — rr Gm Risk
FS i i i S oo Skew
un
é 2 |
= -
304 | o8
E Fg
08 | =
“ are evds or zB > oe we aAaaAKks fan as Se pasa oo >
Be See TS SSE SET ESSER BSSRPEGBSGESESSEESRSHRASSHESESES
TUF aAMmMeteOzpeoaPr ates sGtrAFrrDIuMes FItOet et ese5 oe td5guunRg FG
BE MPSOT FC END ES EEL ERS ApVPeSwenEDAgVEBZEMDEBENDSRENRDZEBRSGZS
@2@esesgs Ss) >i = oO FEF, Q2RnE8 8F84 az,ma=o75 oes) oAaAF> B®@a5 LS
AAFrESRPZERZ eeprHAseG BSR Z SG 2°88 SSE mr PSoRTS ti SstztoasnaokK =P
xpeePSesrestsesret ess hvtEestepes s SSBFr>SSasksee& x FH=zGH
[= a : [o} fast o = ca = so =
2eeeo PSC SS WGRBGSH PZeSV*BSZGZrATSATEWAGFS Lea"
2 202° Bs - Ya ez = 8 u 6s fy 8
a 3 = oO =~ BO
is) 8 oO ow & 7) = ao = EQa
a ra
Source: BofA Merrill Lynch Global Research. **Latest as of 2-Jun-17. Change vs 1 week prior (26-May-17).
The GFSI Risk Allocator (using Bull, Bear & Neutral weights of 2, 0, 1} suggested a 21.7%
overweight position on 2-Jun (vs 13.0% OW as of 26-May). The percentages of Bullish,
Bearish and Neutral GFSI components (as used in the Risk Allocator) as of 2-Jun were
30.4%, 8.7% and 60.9% respectively.
2 Global Equity Volatility Insights | 06 June 2017 oat Z
HOUSE_OVERSIGHT_023576
Document Preview

Click to view full size
Document Details
| Filename | HOUSE_OVERSIGHT_023576.jpg |
| File Size | 0.0 KB |
| OCR Confidence | 85.0% |
| Has Readable Text | Yes |
| Text Length | 3,057 characters |
| Indexed | 2026-02-04T16:51:27.186910 |