HOUSE_OVERSIGHT_023583.jpg
Extracted Text (OCR)
Notable trends and dislocations (US)
Major US equity indices soar to all-time highs as the low vol regime persists
Friday marked the end of the second full week following the political turmoil on Wed,
17-May. Since then, volatility has once again collapsed (10d realized is at 4.6%) and the
S&P 500 term structure of volatility has steepened with the 3m-1m spread trading in
the 90" 2y %-ile. Low S&P 500 short-dated vols pushed down the back end of the curve
(ly and beyond), while Russell 2000 1y+ vols remained bid (Chart 19}. Last week, the VIX
printed 2 of its 15 closes below 10 since 1990 (Chart 20). Vol-of-vol remained
supported with the VVIX/VIX ratio setting yet another record (8.58) on Friday. All of this
happened as SPX, NDX and INDU finished the week at all-time highs.
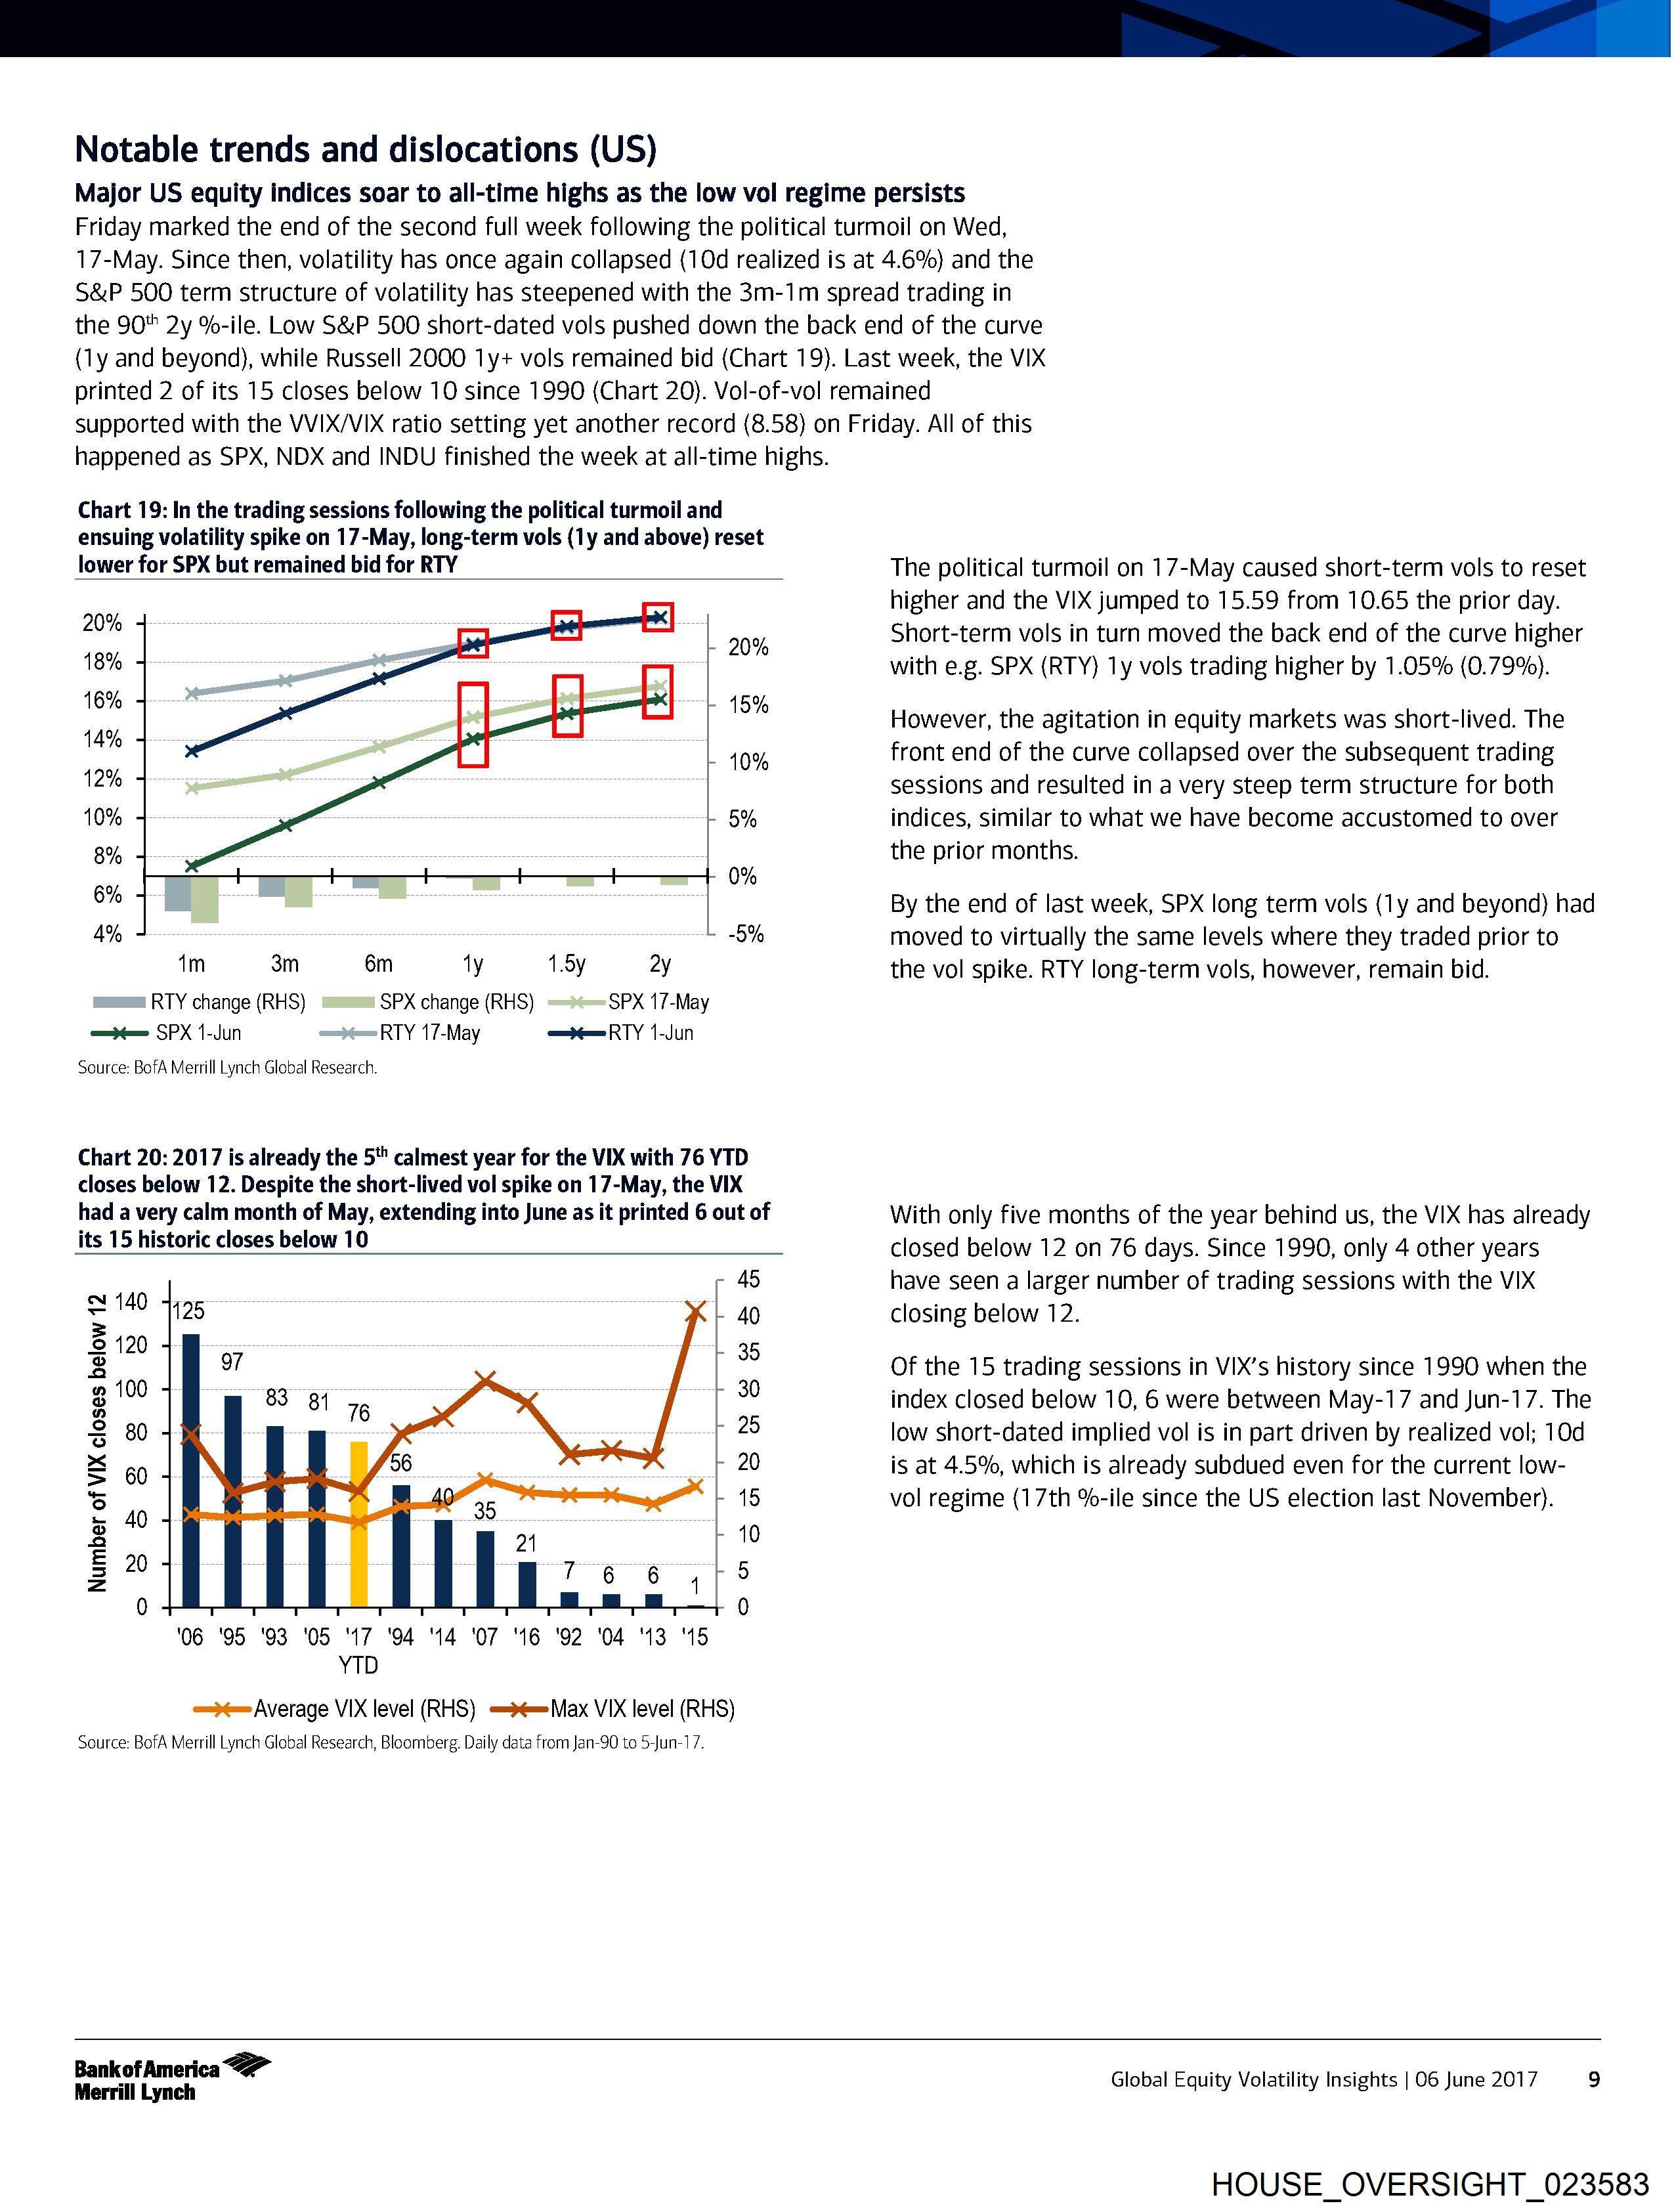
Chart 19: In the trading sessions following the political turmoil and
ensuing volatility spike on 17-May, long-term vols (ly and above) reset
lower for SPX but remained bid for RTY
20%
419% 20%
16% 15%
14% ;
_ 10%
10% 5%
8%
0%
6%
4% -5%
1m 3m 6m ly 1.5y 2y
RTY change (RHS) SPX change (RHS) SPX 17-May
=== SPX 1-Jun RTY 17-May =——_RTY 1-Jun
Source: BofA Merrill Lynch Global Research.
Chart 20: 2017 is already the 5" calmest year for the VIX with 76 YTD
closes below 12. Despite the short-lived vol spike on 17-May, the VIX
had a very calm month of May, extending into June as it printed 6 out of
its 15 historic closes below 10
45
™N
. 140 a8
317 35
100 30
an
3 80 25
= 60 2
= 40 0
a2
E 20
=z
0
‘06 ‘95 ‘93 '05 ‘17 ‘94 ‘14 ‘07 16 '92 ‘04 13 ‘15
YTD
== >= Average VIX level (RHS) —)=Max VIX level (RHS)
Source: BofA Merrill Lynch Global Research, Bloomberg. Daily data from Jan-90 to 5-Jun-17.
The political turmoil on 17-May caused short-term vols to reset
higher and the VIX jumped to 15.59 from 10.65 the prior day.
Short-term vols in turn moved the back end of the curve higher
with e.g. SPX (RTY) 1y vols trading higher by 1.05% (0.79%).
However, the agitation in equity markets was short-lived. The
front end of the curve collapsed over the subsequent trading
sessions and resulted in a very steep term structure for both
indices, similar to what we have become accustomed to over
the prior months.
By the end of last week, SPX long term vols (1y and beyond) had
moved to virtually the same levels where they traded prior to
the vol spike. RTY long-term vols, however, remain bid.
With only five months of the year behind us, the VIX has already
closed below 12 on 76 days. Since 1990, only 4 other years
have seen a larger number of trading sessions with the VIX
closing below 12.
Of the 15 trading sessions in VIX’s history since 1990 when the
index closed below 10, 6 were between May-17 and Jun-17. The
low short-dated implied vol is in part driven by realized vol; 10d
is at 4.5%, which is already subdued even for the current low-
vol regime (17th %-ile since the US election last November).
Bankof America
Merrill Lynch
Global Equity Volatility Insights | O06 June 2017 9
HOUSE_OVERSIGHT_023583
Document Preview

Click to view full size
Document Details
| Filename | HOUSE_OVERSIGHT_023583.jpg |
| File Size | 0.0 KB |
| OCR Confidence | 85.0% |
| Has Readable Text | Yes |
| Text Length | 3,016 characters |
| Indexed | 2026-02-04T16:51:27.376444 |
Related Documents
Documents connected by shared names, same document type, or nearby in the archive.