HOUSE_OVERSIGHT_023598.jpg
Extracted Text (OCR)
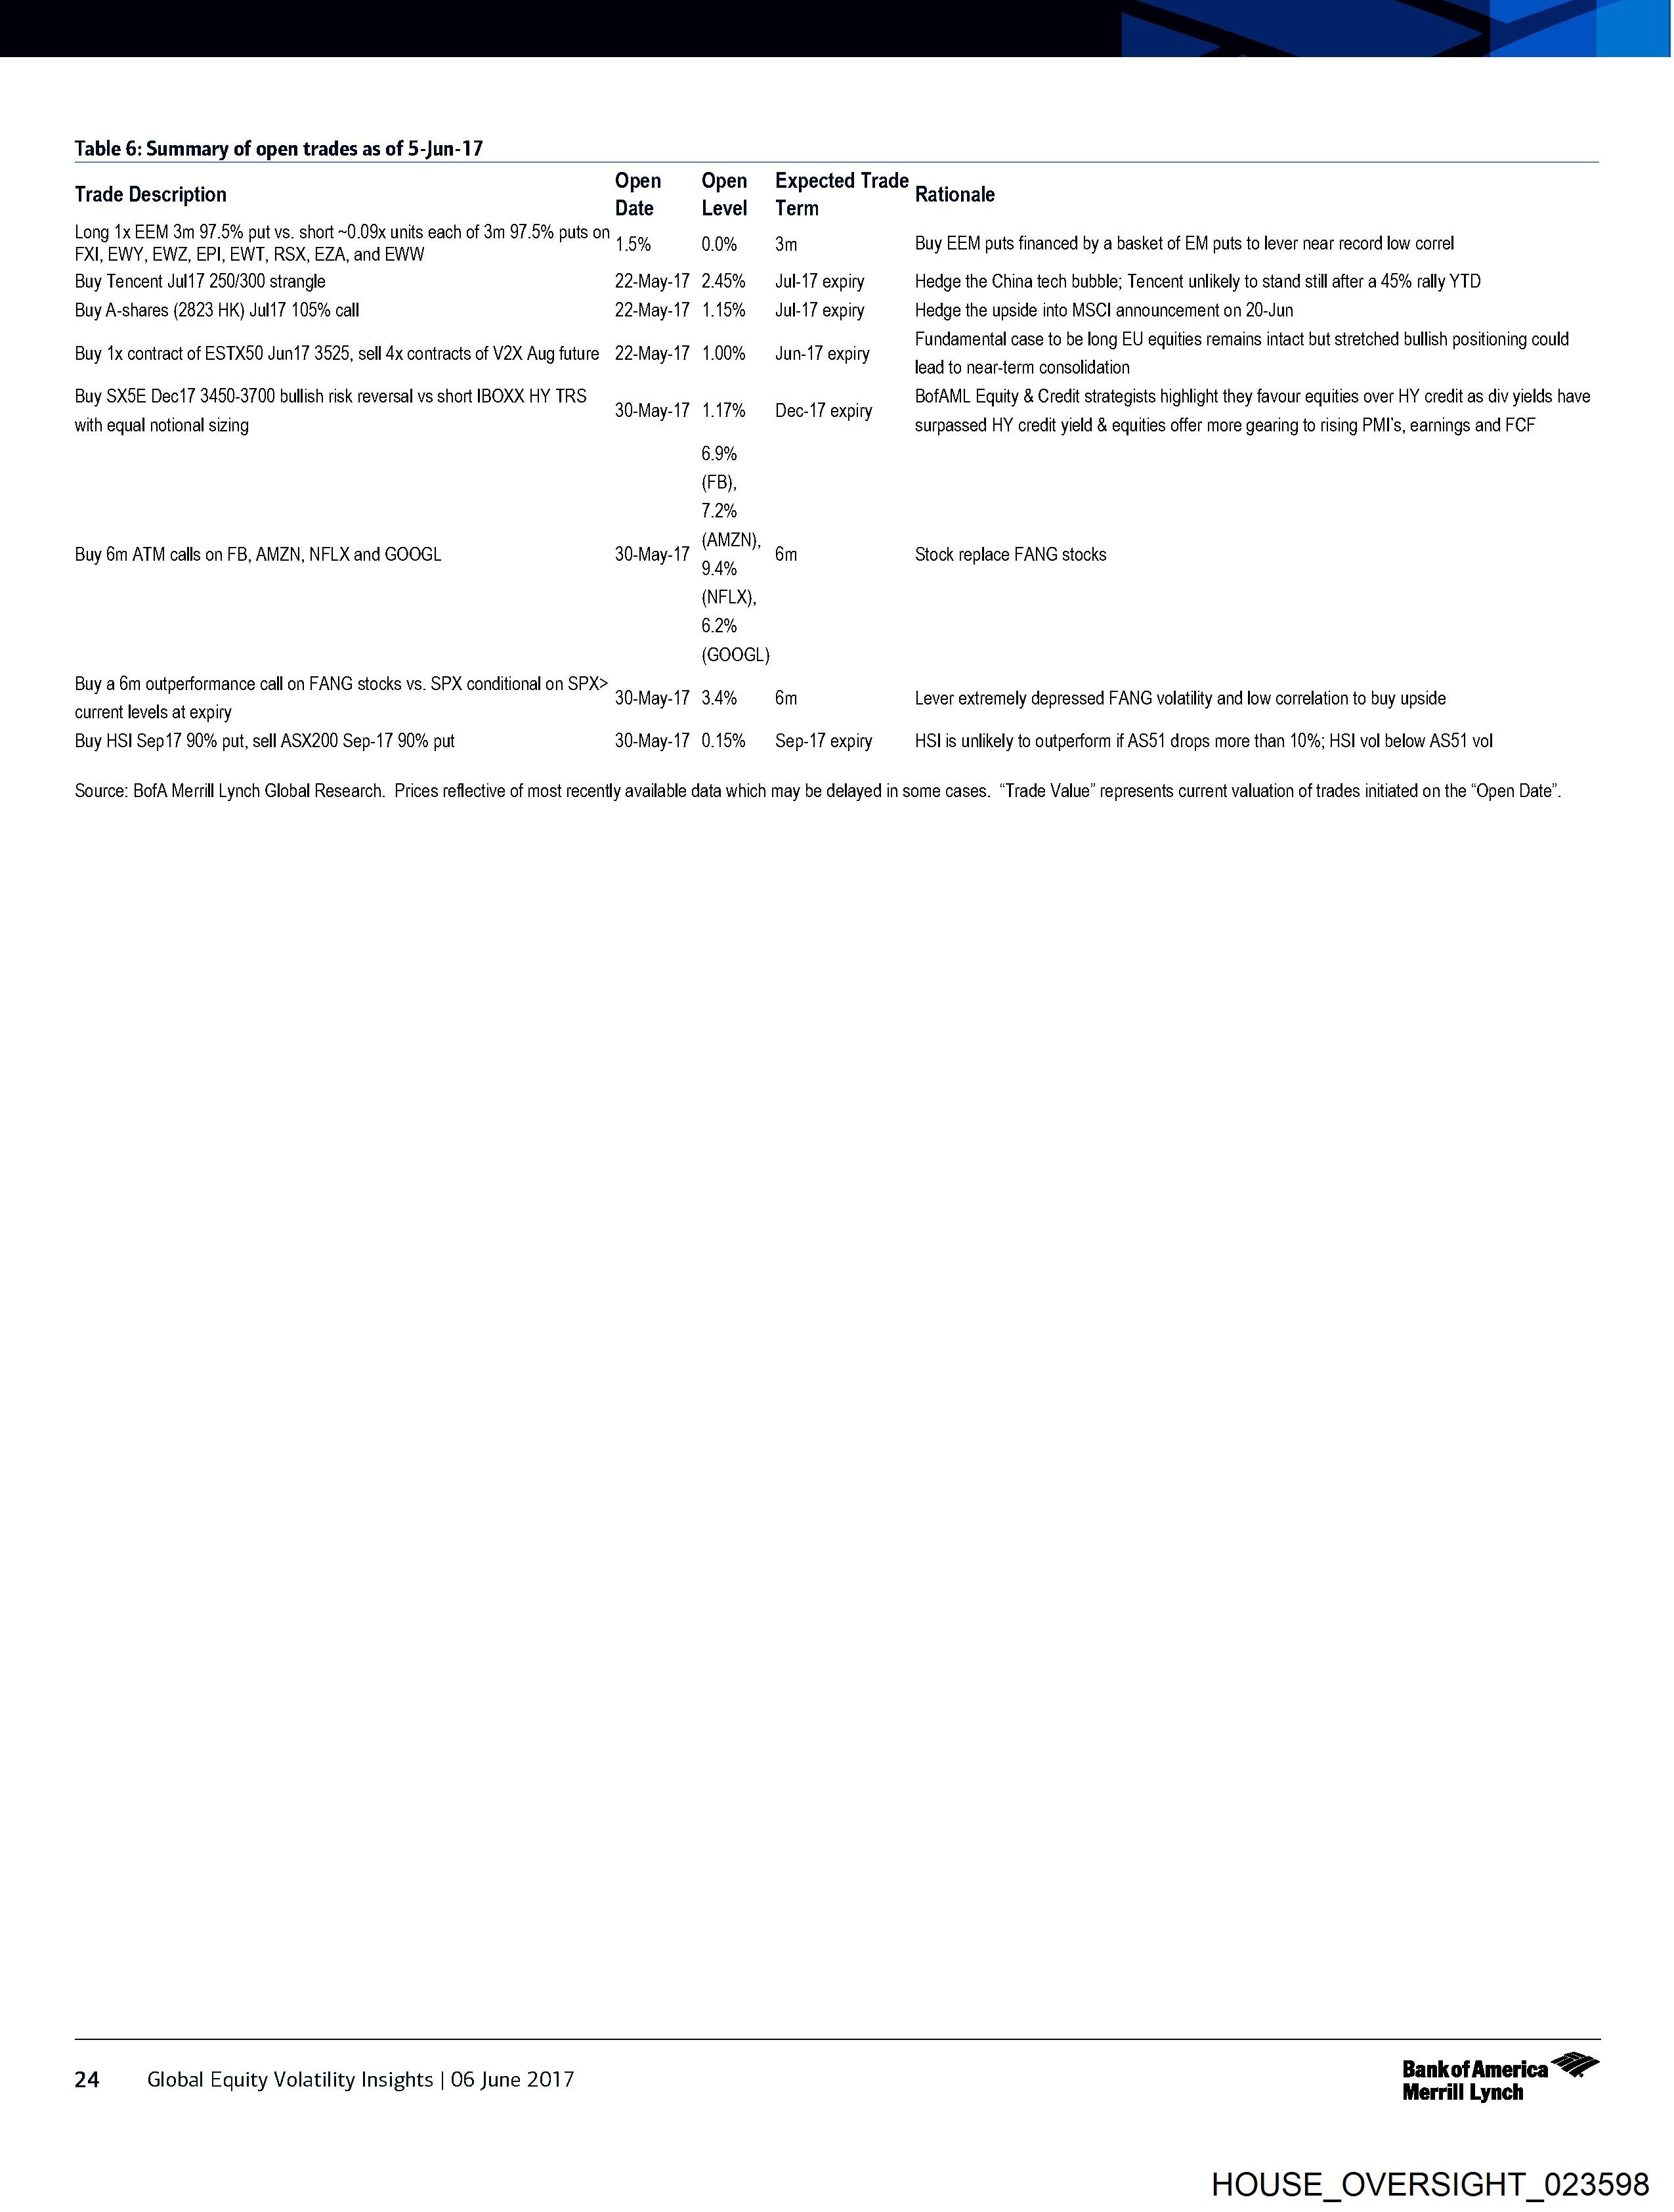
Table 6: Summary of open trades as of 5-Jun-17
Trade Description Open Open
Date Level
Long 1x EEM 3m 97.5% put vs. short ~0.09x units each of 3m 97.5% puts on 15% 0.0%
FXI, EWY, EW2Z, EPI, EWT, RSX, EZA, and EWW “e “
Buy Tencent Jult? 250/300 strangle 22-May-17 2.45%
Buy A-shares (2823 HK) Jul17 105% call 22-May-17 1.15%
Buy 1x contract of ESTX50 Jun17 3525, sell 4x contracts of V2X Aug future 22-May-17 1.00%
Buy SX5E Dec17 3450-3700 bullish risk reversal vs short IBOXX HY TRS
. . _. 30-May-17 1.17%
with equal notional sizing
6.9%
(FB),
1.2%
(AMZN),
Buy 6m ATM calls on FB, AMZN, NFLX and GOOGL 30-May-17 9.4%
10
(NFLX),
6.2%
(GOOGL)
Buy a 6m outperformance call on FANG stocks vs. SPX conditional on SPX>
current levels at expiry
Buy HSI Sep 17 90% put, sell ASX200 Sep-17 90% put 30-May-17 0.15%
30-May-17 3.4%
Expected Trade
Term
3m
Jul-17 expiry
Jul-17 expiry
Jun-17 expiry
Dec-17 expiry
6m
Sep-17 expiry
Rationale
Buy EEM puts financed by a basket of EM puts to lever near record low correl
Hedge the China tech bubble; Tencent unlikely to stand still after a 45% rally YTD
Hedge the upside into MSCI announcement on 20-Jun
Fundamental case to be long EU equities remains intact but stretched bullish positioning could
lead to near-term consolidation
BofAML Equity & Credit strategists highlight they favour equities over HY credit as div yields have
surpassed HY credit yield & equities offer more gearing to rising PMI’s, earnings and FCF
Stock replace FANG stocks
Lever extremely depressed FANG volatility and low correlation to buy upside
HSl is unlikely to outperform if AS51 drops more than 10%; HSI vol below AS51 vol
Source: BofA Merrill Lynch Global Research. Prices reflective of most recently available data which may be delayed in some cases. “Trade Value” represents current valuation of trades initiated on the “Open Date”.
24 Global Equity Volatility Insights | 06 June 2017
BankofAmerica
Merrill Lynch
HOUSE_OVERSIGHT_023598
Document Preview

Click to view full size
Document Details
| Filename | HOUSE_OVERSIGHT_023598.jpg |
| File Size | 0.0 KB |
| OCR Confidence | 85.0% |
| Has Readable Text | Yes |
| Text Length | 1,984 characters |
| Indexed | 2026-02-04T16:51:29.740980 |