HOUSE_OVERSIGHT_023591.jpg
Extracted Text (OCR)
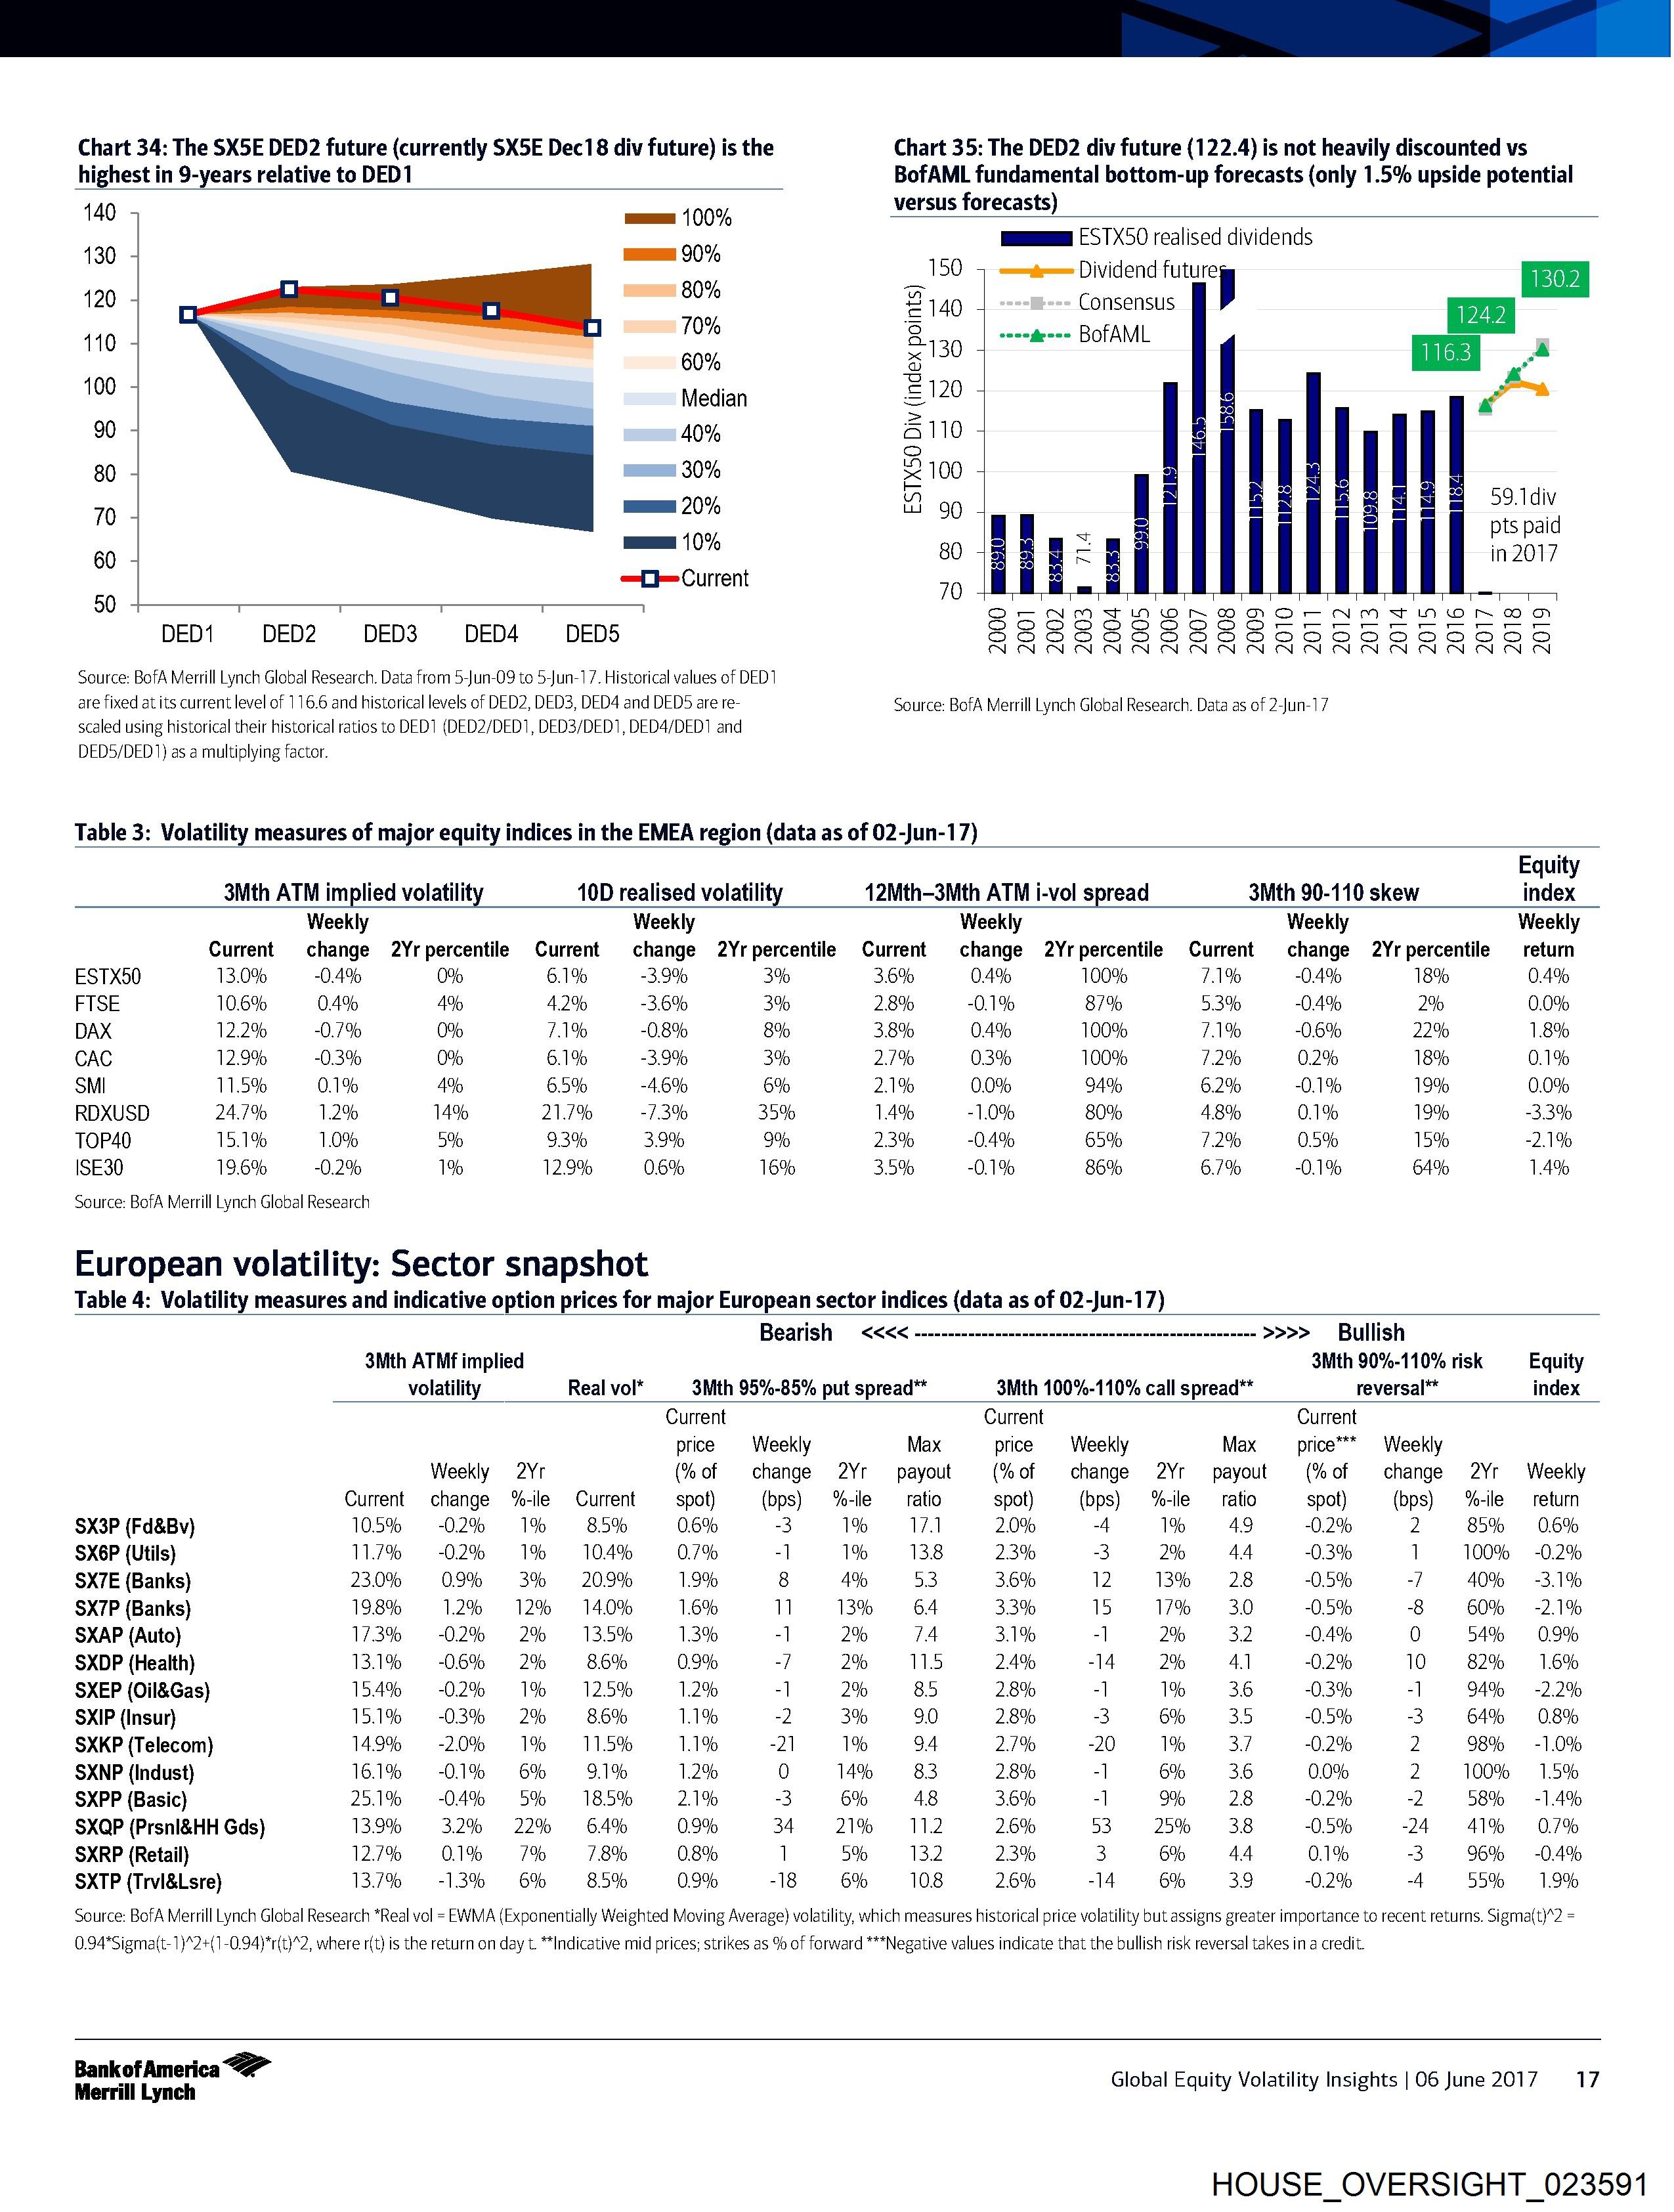
Chart 34: The SX5E DED2 future (currently SX5E Dec18 div future) is the Chart 35: The DED2 div future (122.4) is not heavily discounted vs
highest in 9-years relative to DED1 BofAML fundamental bottom-up forecasts (only 1.5% upside potential
440 400% versus forecasts) , =
130 90% ; Saag Bal Rad realised dividends
rk 50 7 =mtee= Dividend future 1302
120 ans 2, Consensus
40 +
70% 3 s-e-ite--+ BofAML Ze
110 2130 4 "
60% = 1163 io
Ga
10 Median £120 5 va
90 40% Allo 4 3
Ss S
80 30% 5< 100 4 |
70 mmm 20% 2 990 J 59.1 div
mes 10% 2 =_ a ps pe
60 ° 80/8 age in 2017
=—O—Current 70 a
50 Se AA Fe Gre Sa KM ot AS ms SY
DED1 DED2 DED3 ODED4 DEDS SSSSSSSSSESESNS5SSSSSSESS
TENN NNN NON NON ON ON ON ON ON ON ON
Source: BofA Merrill Lynch Global Research. Data from 5-Jun-09 to 5-Jun-17. Historical values of DED1
are fixed at its current level of 116.6 and historical levels of DED2, DED3, DED4 and DED5 are re- Source: BofA Merrill Lynch Global Research. Data as of 2-Jun-17
scaled using historical their historical ratios to DED1 (DED2/DED1, DED3/DED1, DED4/DED1 and
DED5/DED1) as a multiplying factor.
Table 3: Volatility measures of major equity indices in the EMEA region (data as of 02-Jun-17)
Equity
3Mth ATM implied volatilit 10D realised volatili 12Mth-3Mth ATM i-vol spread 3Mth 90-110 skew index
Weekly Weekly Weekly Weekly Weekly
Current change 2Yrpercentile Current change 2Yrpercentile Current change 2Yrpercentile Current change 2Yrpercentile return
ESTX50 3.0% -0.4% 0% 6.1% -3.9% 3% 3.6% 0.4% 100% 7.1% 0A% 18% 0.4%
FTSE 0.6% 0.4% 4% 4.2% -3.6% 3% 2.8% -0.1% 87% 5.3% 0.4% 2% 0.0%
DAX 2.2% -0.7% 0% 7.1% -0,8% 8% 3.8% 0.4% 100% 7.1% 0.6% 22% 1.8%
CAC 2.9% 0.3% 0% 6.1% -3.9% 3% 2.7% 0.3% 100% 7.2% 0.2% 18% 0.1%
SMI 1.5% 0.1% 4% 6.5% -4.6% 6% 2.1% 0.0% 94% 6.2% 0.1% 19% 0.0%
RDXUSD 24.7% 1.2% 14% 21.7% -7.3% 35% 14% -1.0% 80% 4.8% 0.1% 19% -3.3%
TOP40 5.19% 1.0% 5% 9.3% 3.9% 9% 23% -0.4% 65% 7.2% 0.5% 15% -2.1%
ISE30 9.6% -0.2% 1% 12.9% 0.6% 16% 3.5% -0.1% 86% 6.7% 0.1% 64% 1.4%
Source: BofA Merrill Lynch Global Research
European volatility: Sector snapshot
Table 4: Volatility measures and indicative option prices for major European sector indices (data as of 02-Jun-17)
Bearish — <<<< ---------------------necnnnencne ence cnennccnnnens >>>> Bullish
3Mth ATMf implied 3Mth 90%-110% risk Equity
volatility Real vol* 3Mth 95%-85% put spread 3Mth 100%-110% call spread** reversal** index
Current Current Current
price Weekly Max price Weekly Max price™* Weekly
Weekly 2Yr (%of change 2Yr payout (%of change 2Yr payout (%of change 2Yr Weekly
Current change %-ile Current spot) (bps) %-ile ratio spot) (bps) %-ile ratio spot) (bps) %-ile — return
SX3P (Fd&Bv) 0.5% -02% 1% 85% 0.6% -3 1% 71 2.0% -4 1% 49 -0.2% 2 85% 0.6%
SX6P (Utils) 1.7% = -0.2% = 1% 0.4% 0.7% -] 1% 13.8 2.3% 3 2% 44 -~0.3% 1 100% — -0.2%
SX7E (Banks) 23.0% 0.9% 3% 20.9% 9% 8 4% 53 3.6% 12 13% 28 -0.5% -] 40% — -3.1%
SX7P (Banks) 98% 12% 12% 14.0% 6% 1 13% 64 3.3% 15 17% 3.0 -0.5% -8 60% —-2.1%
SXAP (Auto) 73% = -0.2% 2% 3.5% 3% -] 2% 74 3.1% = 2% 3.2 0.4% 0 54% 0.9%
SXDP (Health) 3.1% -0.6% 2% 86% 0.9% -7 2% 115 24% -14 2% 4] -0.2% 10 = 82% = 1.6%
SXEP (Oil&Gas) 5A% = -0.2% = 1% 2.5% 2% -] 2% 85 2.8% -] 1% 3.6 -0.3% -] 94% — -2.2%
SXIP (Insur) 5.1% -03% 2% 86% 1% =2 3% 9.0 2.8% 3 6% 35 -0.5% 3 64% 0.8%
SXKP (Telecom) 49% -2.0% 1% 1.5% 1% -21 1% 94 2.7% -20 1% 37 -0.2% 2 98% — -1.0%
SXNP (Indust) 6.1% -0.1% 6% 9.1% 2% 0 14% 83 2.8% =| 6% 3.6 0.0% 2 100% 1.5%
SXPP (Basic) 25.1% -04% 5% 8.5% 2.1% -3 6% 48 3.6% “] 9% 28 -0.2% -2 58% — -1.49%
SXQP (Prsnl&HH Gds) 3.9% 3.2% 22% 64% 0.9% 34. 21% = 11.2 2.6% 53 25% 38 -0.5% 24 41% = 0.7%
SXRP (Retail) 27% 0.1% 7% 78% 0.8% 1 5% 13.2 2.3% 3 6% 44 0.1% 3 96% -0.4%
SXTP (Trvl&Lsre) 3.7% -13% 6% 85% 0.9% -18 6% 108 2.6% -14 6% 39 -0.2% -4 55% = 1.9%
Source: BofA Merrill Lynch Global Research *Real vol = EWMA (Exponentially Weighted Moving Average) volatility, which measures historical price volatility but assigns greater importance to recent returns. Sigma(t)*2 =
0.94*Sigma(t-1)*2+(1-0.94)*r(t}*2, where r(t) is the return on day t. “Indicative mid prices; strikes as % of forward ***Negative values indicate that the bullish risk reversal takes in a credit.
Bankof America <> ’ arietive
Merrill Lynch Global Equity Volatility Insights | O06 June 2017 17
HOUSE_OVERSIGHT_023591
Document Preview

Click to view full size
Document Details
| Filename | HOUSE_OVERSIGHT_023591.jpg |
| File Size | 0.0 KB |
| OCR Confidence | 85.0% |
| Has Readable Text | Yes |
| Text Length | 4,351 characters |
| Indexed | 2026-02-04T16:51:31.203608 |