HOUSE_OVERSIGHT_024254.jpg
Extracted Text (OCR)
Viacom
MTV, VH1, CMT, BET, Nickelodeon, Nick Jr, Comedy Central, TV Land, SPIKE, and more. Do these sound
like brands that are likely to suffer? No. Viacom, Inc. (VIA) is a profitable company that pays a small dividend.
On the other hand, a debt-to-equity ratio of 3.88 isn’t comforting.
Time Warner
Time Warner Inc. (TWX) has 165 channels across 200 countries. This includes HBO. In FY2014, revenue
increased 3%. That’s not spectacular, but adjusted EPS jumped 18%, which now represents six consecutive
years of adjusted EPS growth in the high teens. Time Warner also returned $6.6 billion to shareholders via
dividends and buybacks throughout the year. Over the long haul, cable companies will have a difficult time
competing against streaming services, but all is okay for right now.
Scripps Networks Interactive
Among Scripps Networks Interactive, Inc.'s (SNI) properties are Home and Garden Television, Food Network,
Travel Channel, DIY Network, Cooking Channel and Great American Country. These are strong brands. Strong
enough that Scripps Networks expects FY2015 revenue to increase approximately 4%. The company also
expects selling, general, and administrative expenses to come in between flat and down 2%. Either way, it’s a
positive when revenue is outpacing SG&A expenses. Furthermore, Scripps Networks has announced that it’s
adding $1 billion to its share buyback program and increasing its dividend by 15%. The risk here is the stock’s
sensitivity to broader market corrections. (For a look back to 2009, see: Scripps Network Interactive Worth a
Look.)
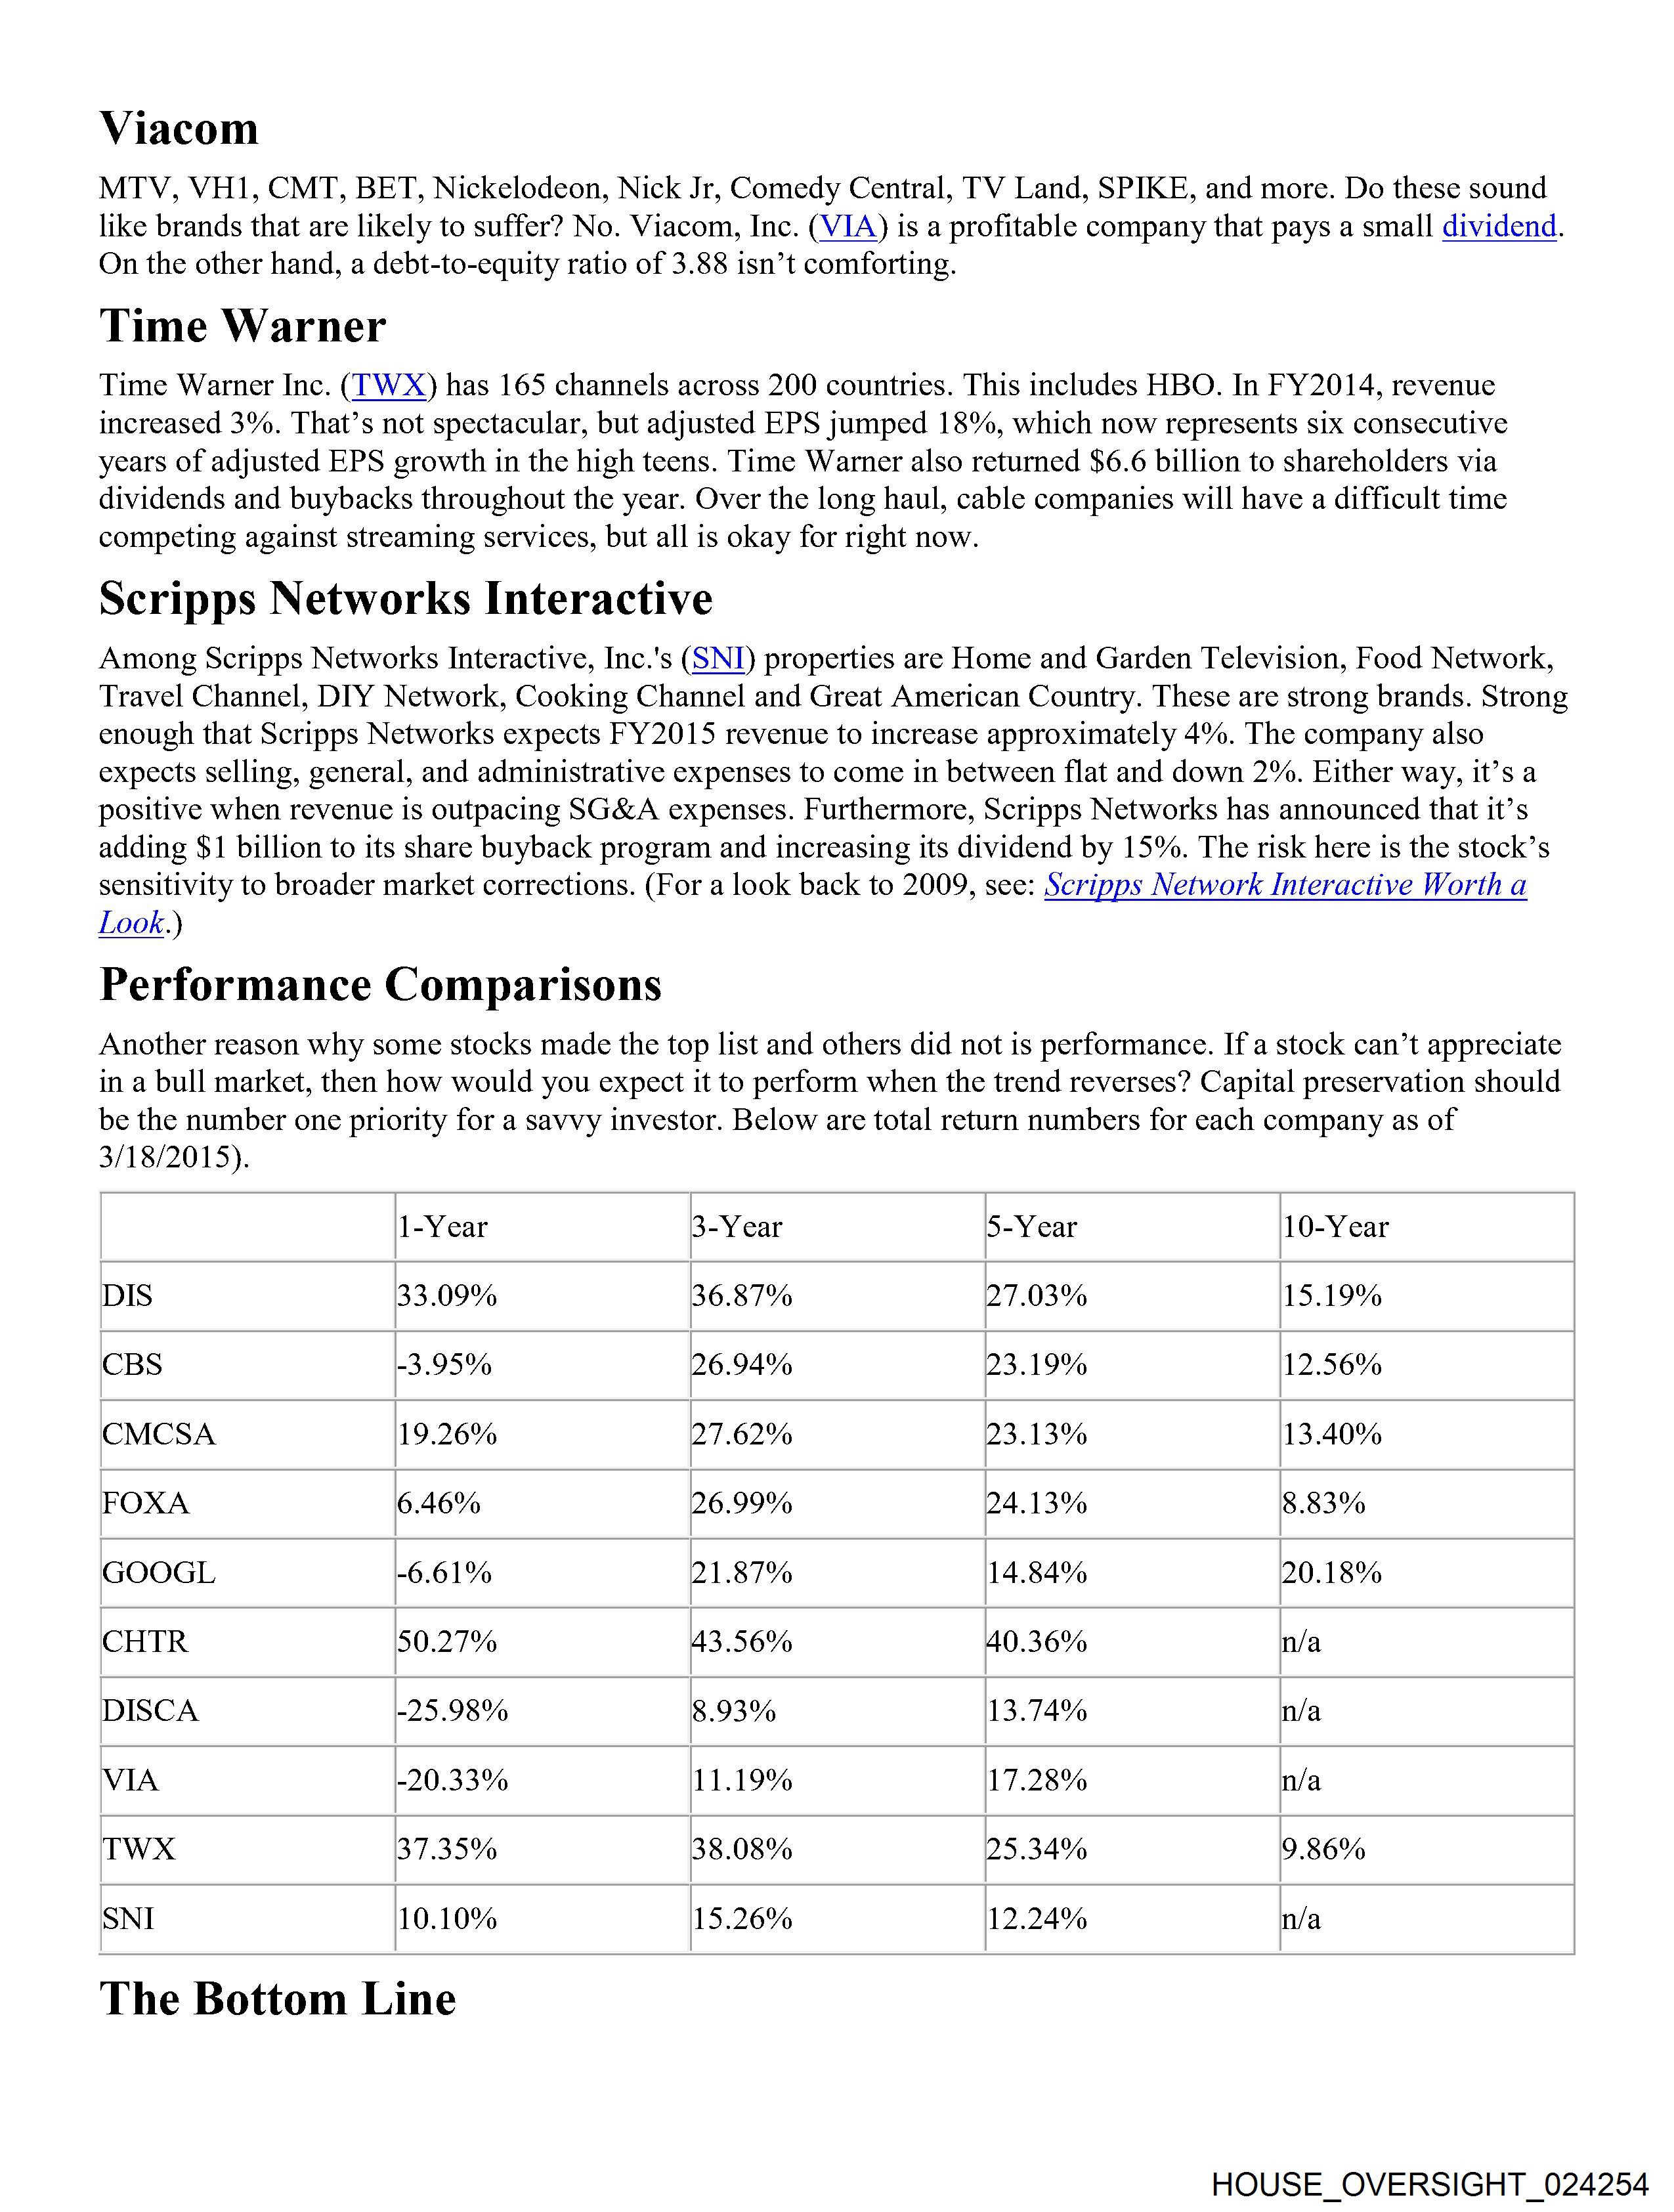
Performance Comparisons
Another reason why some stocks made the top list and others did not is performance. If a stock can’t appreciate
in a bull market, then how would you expect it to perform when the trend reverses? Capital preservation should
be the number one priority for a savvy investor. Below are total return numbers for each company as of
3/18/2015).
1-Year 3-Year 5-Year 10-Year
DIS 33.09% 36.87% 27.03% 15.19%
CBS -3.95% 26.94% 23.19% 12.56%
CMCSA 19.26% 27.62% 23.13% 13.40%
FOXA 6.46% 26.99% 24.13% 8.83%
GOOGL -6.61% 21.87% 14.84% 20.18%
CHTR 50.27% 43.56% 40.36% n/a
DISCA -25.98% 8.93% 13.74% n/a
VIA -20.33% 11.19% 17.28% n/a
TWX 37.35% 38.08% 25.34% 9.86%
SNI 10.10% 15.26% 12.24% n/a
The Bottom Line
HOUSE_OVERSIGHT_024254
Document Preview

Click to view full size
Extracted Information
Dates
Document Details
| Filename | HOUSE_OVERSIGHT_024254.jpg |
| File Size | 0.0 KB |
| OCR Confidence | 85.0% |
| Has Readable Text | Yes |
| Text Length | 2,325 characters |
| Indexed | 2026-02-04T16:53:38.124578 |