HOUSE_OVERSIGHT_025988.jpg
Extracted Text (OCR)
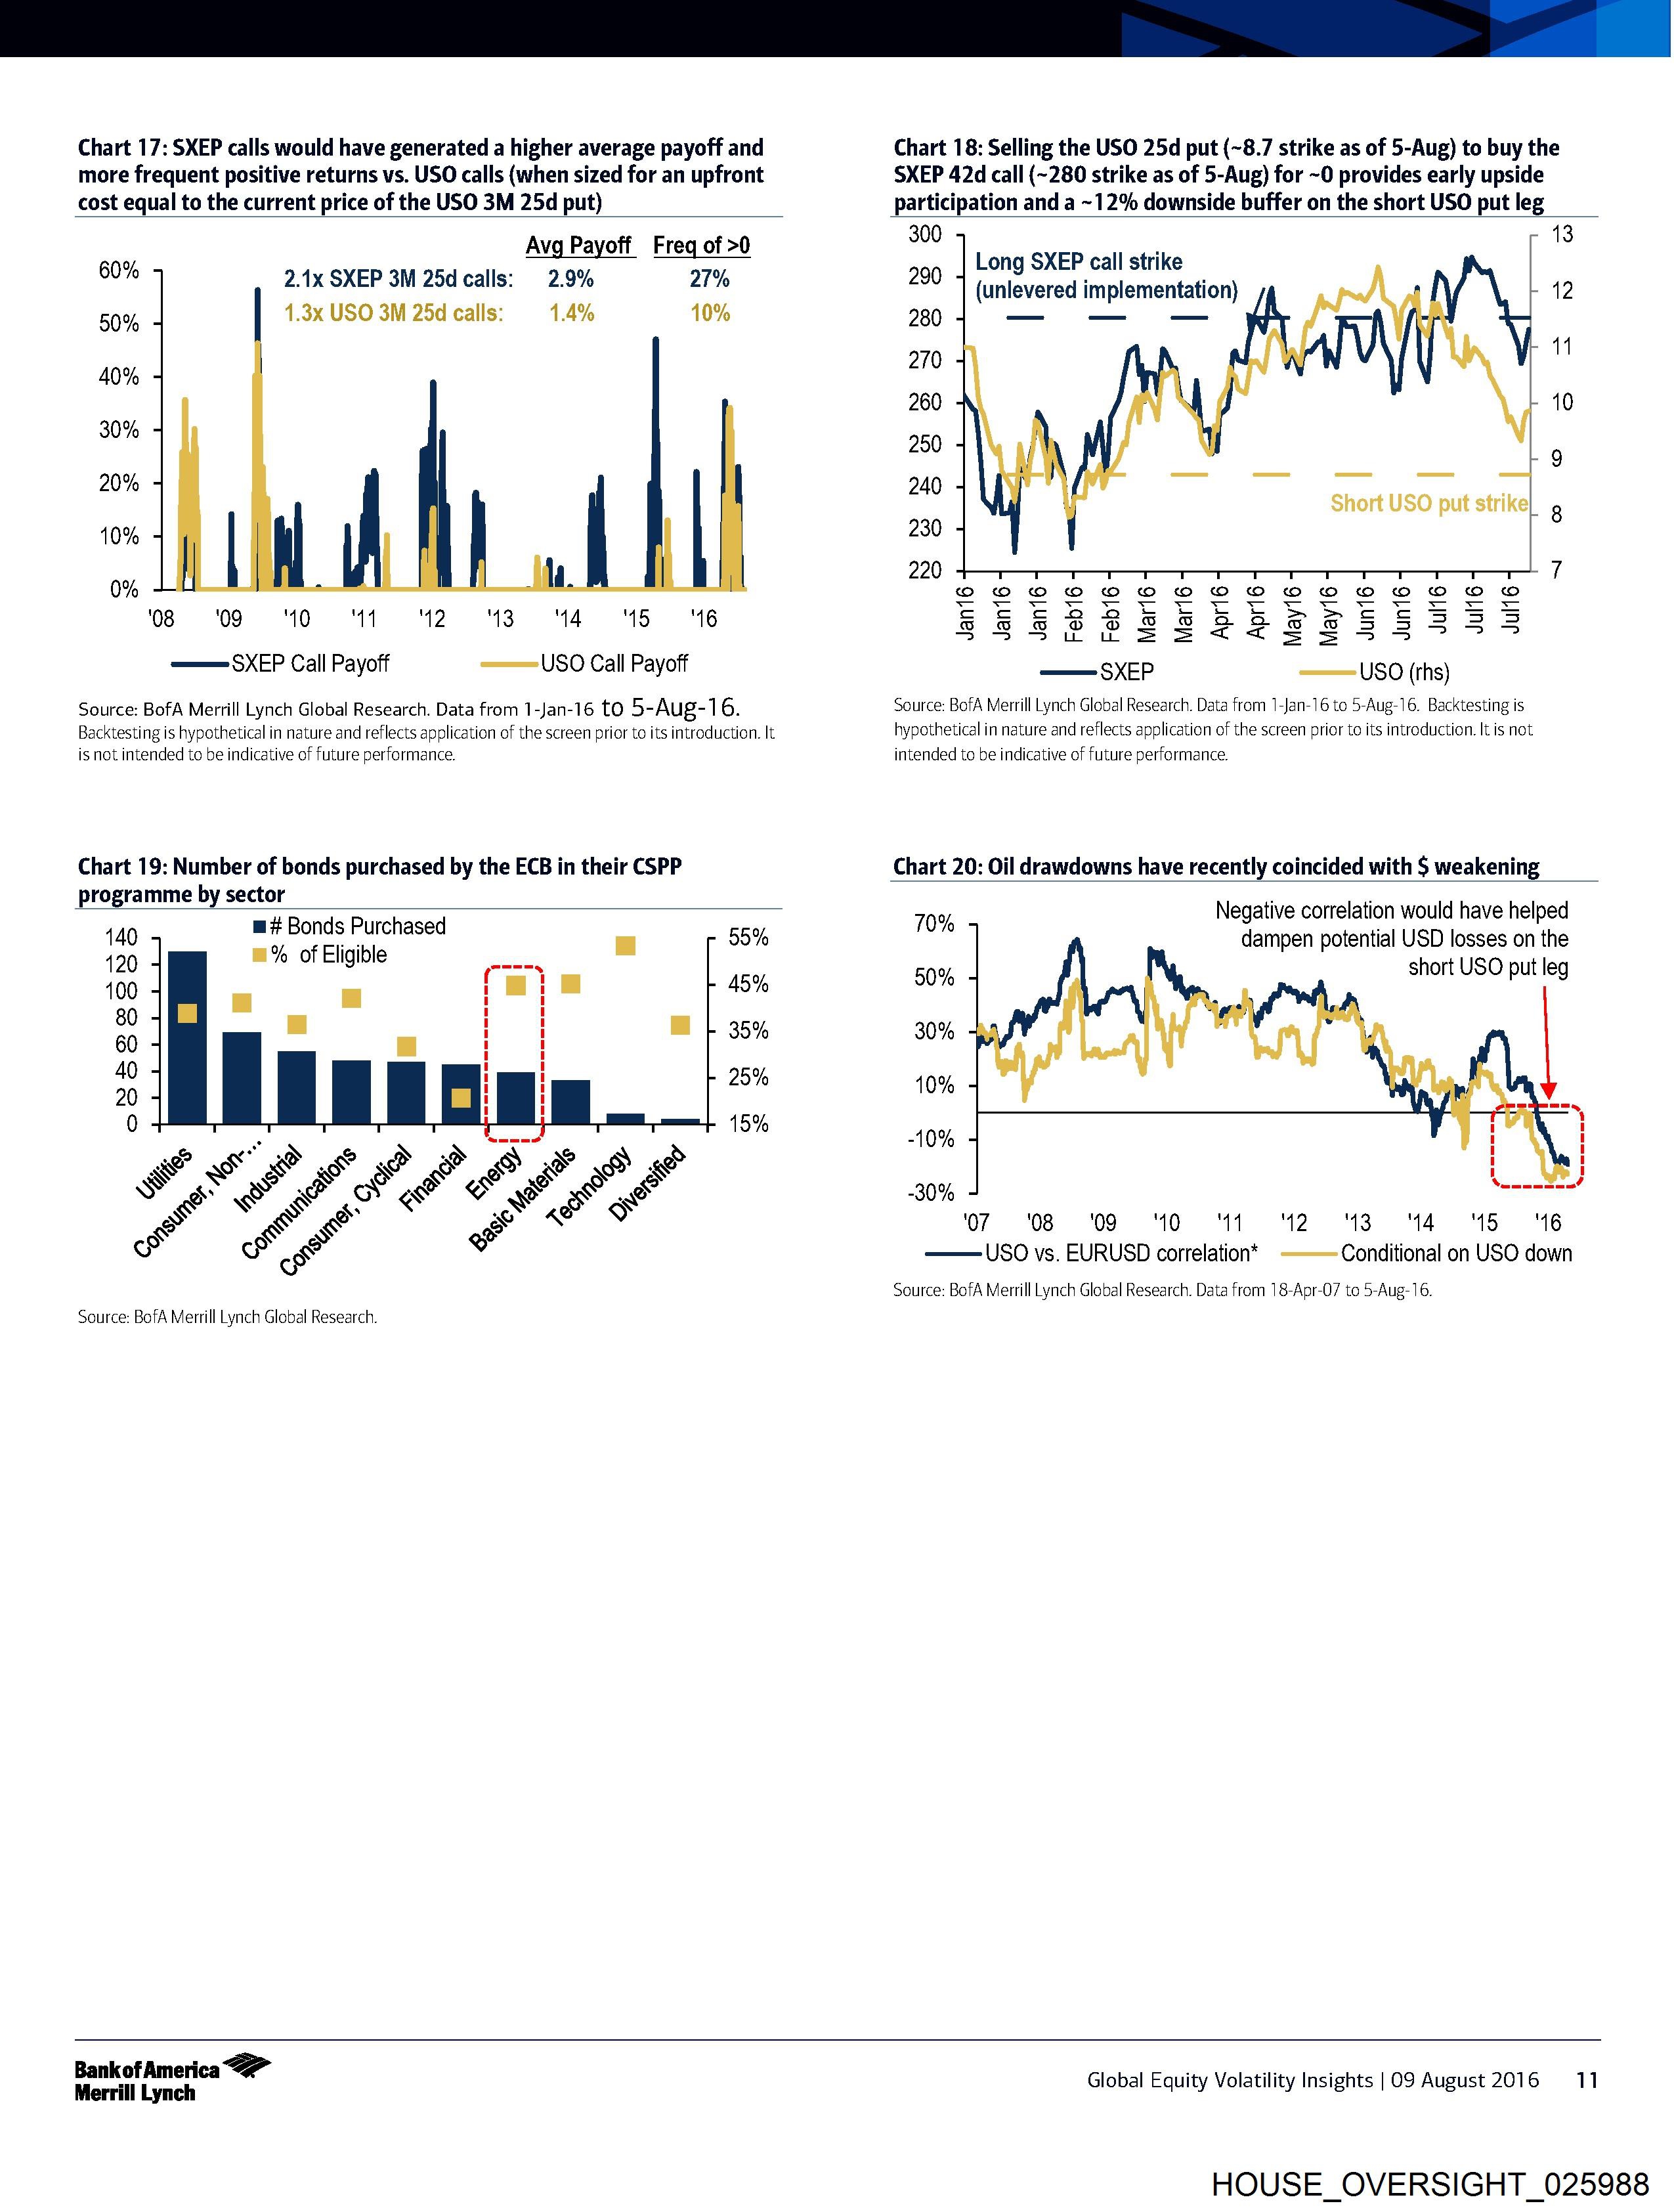
Chart 17: SXEP calls would have generated a higher average payoff and
more frequent positive returns vs. USO calls (when sized for an upfront
cost equal to the current price of the USO 3M 25d put)
Avg Payoff Freq of >0
2.1x SXEP 3M 25d calls: 2.9% 27%
1.3x USO 3M 25d calls: 1.4% 10%
60%
50%
40%
30%
20%
10%
0%
08 09 ‘10 M40 ‘12138 141516
SXEP Call Payoff = USO Call Payoff
Source: BofA Merrill Lynch Global Research. Data from 1-Jan-16 to 5-Aug-1 6.
Backtesting is hypothetical in nature and reflects application of the screen prior to its introduction. It
is not intended to be indicative of future performance.
Chart 19: Number of bonds purchased by the ECB in their CSPP
programme by sector
Chart 18: Selling the USO 25d put (~8.7 strike as of 5-Aug) to buy the
SXEP 42d call (~280 strike as of 5-Aug) for ~0 provides early upside
participation and a ~12% downside buffer on the short USO put leg
300
290
280
270
260
290
240
13
Long SXEP call strike
(unlevered implementation) 12
Short USO put strike|_ 9
230
220 7
oo owo ©O©§ 0 © © © © © © © © © ©
SEESSEEEEEEESS35
SXEP ——USO (rhs)
Source: BofA Merrill Lynch Global Research. Data from 1-Jan-16 to 5-Aug-16. Backtesting is
hypothetical in nature and reflects application of the screen prior to its introduction. It is not
intended to be indicative of future performance.
Chart 20: Oil drawdowns have recently coincided with $ weakening
25%
15%
440 m# Bonds Purchased 55%
138 m% of Eligible __. a °
400 - = { aie 45%
80 o i H |
35%
60 _ °
yt
a 1
1 1
Source: BofA Merrill Lynch Global Research.
Negative correlation would have helped
dampen potential USD losses on the
short USO put leg
70%
50%
30%
10%
10% 1
i
I
-30% saeeter
‘O7 08 09 10 11 12— 13 1415 16
USO vs. EURUSD correlation* Conditional on USO down
Source: BofA Merrill Lynch Global Research. Data from 18-Apr-07 to 5-Aug-16.
Bankof America
Merrill Lynch
Global Equity Volatility Insights |O9 August 2016 =-11
HOUSE_OVERSIGHT_025988
Document Preview

Click to view full size
Document Details
| Filename | HOUSE_OVERSIGHT_025988.jpg |
| File Size | 0.0 KB |
| OCR Confidence | 85.0% |
| Has Readable Text | Yes |
| Text Length | 1,972 characters |
| Indexed | 2026-02-04T16:58:09.175046 |