HOUSE_OVERSIGHT_025987.jpg
Extracted Text (OCR)
Volatility in Europe
Buy the seasonal oil dip via bullish X-market risk reversals
Levered X-market risk reversal: Sell 1x USO 3M 25d (~88% strike) puts
to fully fund 2.1x SXEP (Oil & Gas equity) 25d (~106% strike) calls (indic.)
Alternative (unlevered) implementation: Sell USO 25d puts to fund fully
fund closer to the money SXEP calls
The seasonal sell-off in oil presents a ‘buy the dip’ opportunity according to our
commodity strategists, who expect prices to rebound to $55/bbl by year end. In fact
current levels of ~S40 are close to the summer floor ($39) they had previously
suggested.
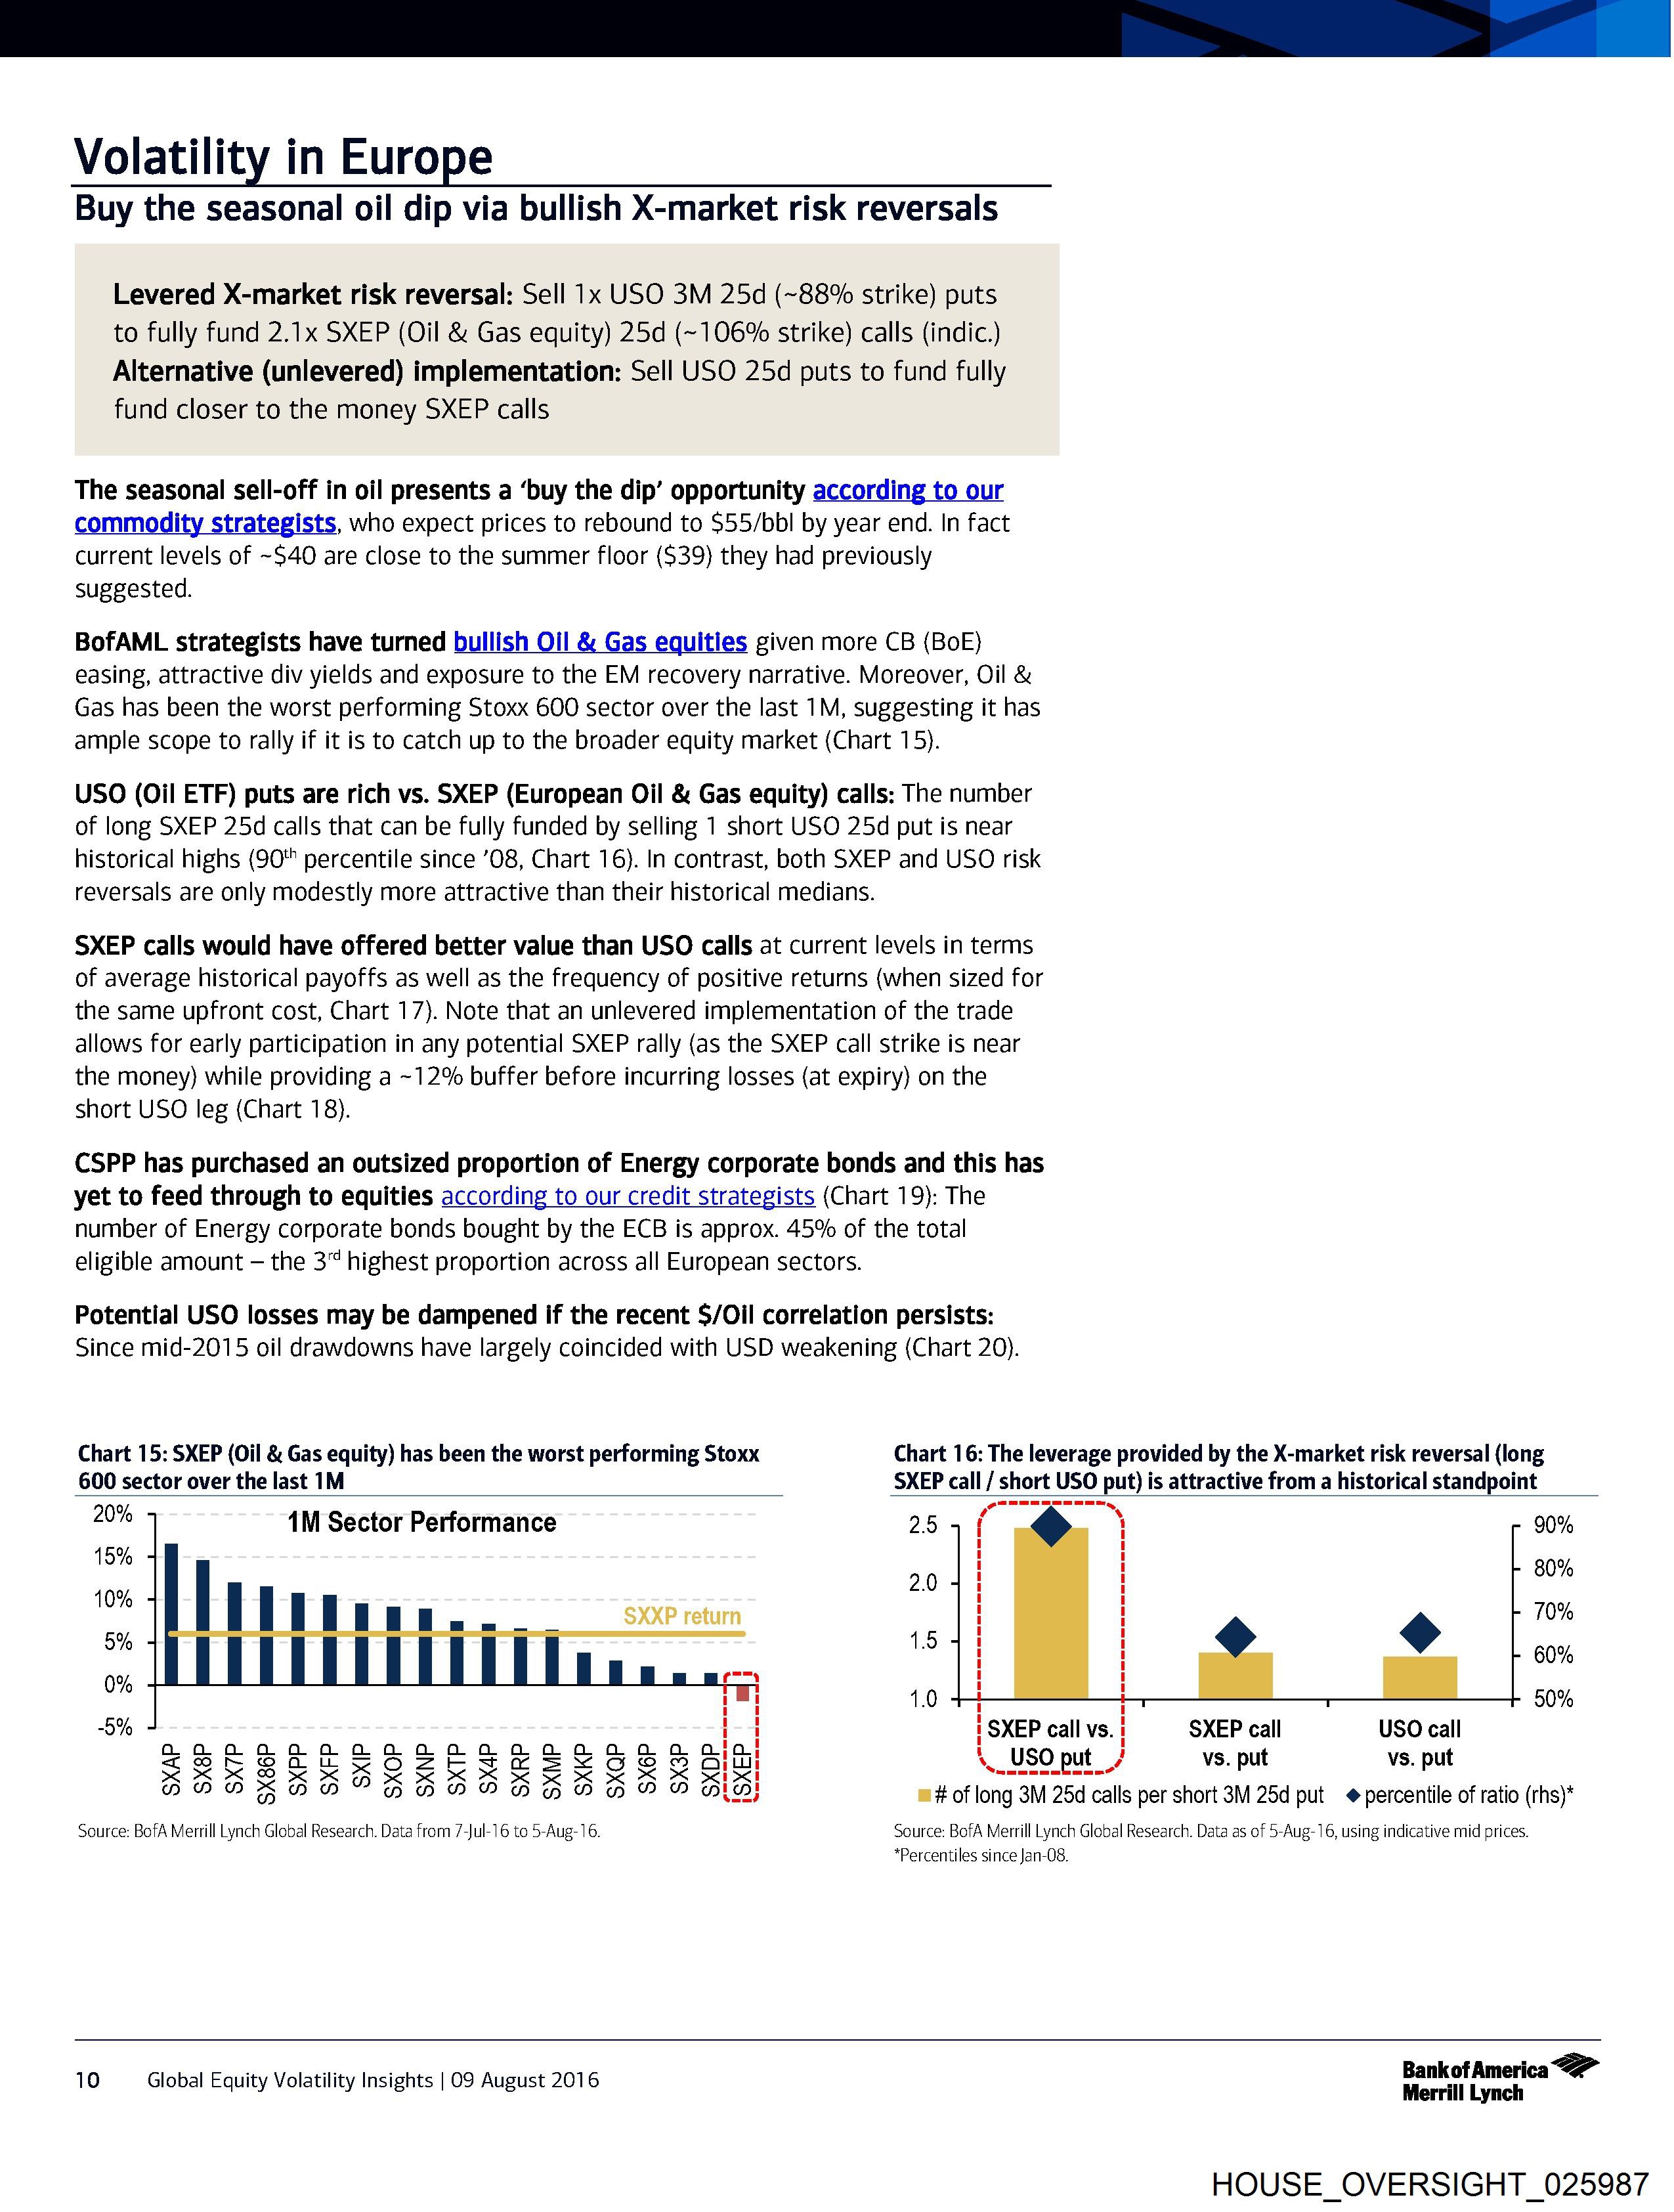
BofAML strategists have turned bullish Oil & Gas equities given more CB (BoE)
easing, attractive div yields and exposure to the EM recovery narrative. Moreover, Oil &
Gas has been the worst performing Stoxx 600 sector over the last 1M, suggesting it has
ample scope to rally if it is to catch up to the broader equity market (Chart 15).
USO (Oil ETF) puts are rich vs. SXEP (European Oil & Gas equity) calls: The number
of long SXEP 25d calls that can be fully funded by selling 1 short USO 25d put is near
historical highs (90" percentile since ’08, Chart 16). In contrast, both SXEP and USO risk
reversals are only modestly more attractive than their historical medians.
SXEP calls would have offered better value than USO calls at current levels in terms
of average historical payoffs as well as the frequency of positive returns (when sized for
the same upfront cost, Chart 17). Note that an unlevered implementation of the trade
allows for early participation in any potential SXEP rally (as the SXEP call strike is near
the money) while providing a ~12% buffer before incurring losses (at expiry) on the
short USO leg (Chart 18).
CSPP has purchased an outsized proportion of Energy corporate bonds and this has
yet to feed through to equities according to our credit strategists (Chart 19): The
number of Energy corporate bonds bought by the ECB is approx. 45% of the total
eligible amount — the 3“ highest proportion across all European sectors.
Potential USO losses may be dampened if the recent $/Oil correlation persists:
Since mid-2015 oil drawdowns have largely coincided with USD weakening (Chart 20).
Chart 15: SXEP (Oil & Gas equity) has been the worst performing Stoxx Chart 16: The leverage provided by the X-market risk reversal (long
600 sector over the last 1M SXEP call / short USO put) is attractive from a historical standpoint
20% 1M Sector Performance 254 : 90%
15%
10%
5%
80%
SXXP return 10%
60%
0% ny
rw 1.0 50%
5% it SXEP call vs. SXEP call USO call
ZSebr-eveantRoZzerTeresxocee au VS. pu VS. pu
BOM BBAK SM SBSKSKRRABMS ape oa . .
” GPP TN BAAOOD DOW DY; m# of long 3M 25d calls per short 3M 25d put + percentile of ratio (rhs)*
Source: BofA Merrill Lynch Global Research. Data from 7-Jul-16 to 5-Aug-16. Source: BofA Merrill Lynch Global Research. Data as of 5-Aug-16, using indicative mid prices.
*Percentiles since Jan-08.
BankofAmerica <2”
10 Global Equity Volatility Insights | O09 August 2016 Merrill Lynch
HOUSE_OVERSIGHT_025987
Document Preview

Click to view full size
Document Details
| Filename | HOUSE_OVERSIGHT_025987.jpg |
| File Size | 0.0 KB |
| OCR Confidence | 85.0% |
| Has Readable Text | Yes |
| Text Length | 3,075 characters |
| Indexed | 2026-02-04T16:58:09.950347 |