HOUSE_OVERSIGHT_025981.jpg
Extracted Text (OCR)
Volatility in the US
Quantifying the (bond-equity correl) risks to risk parity
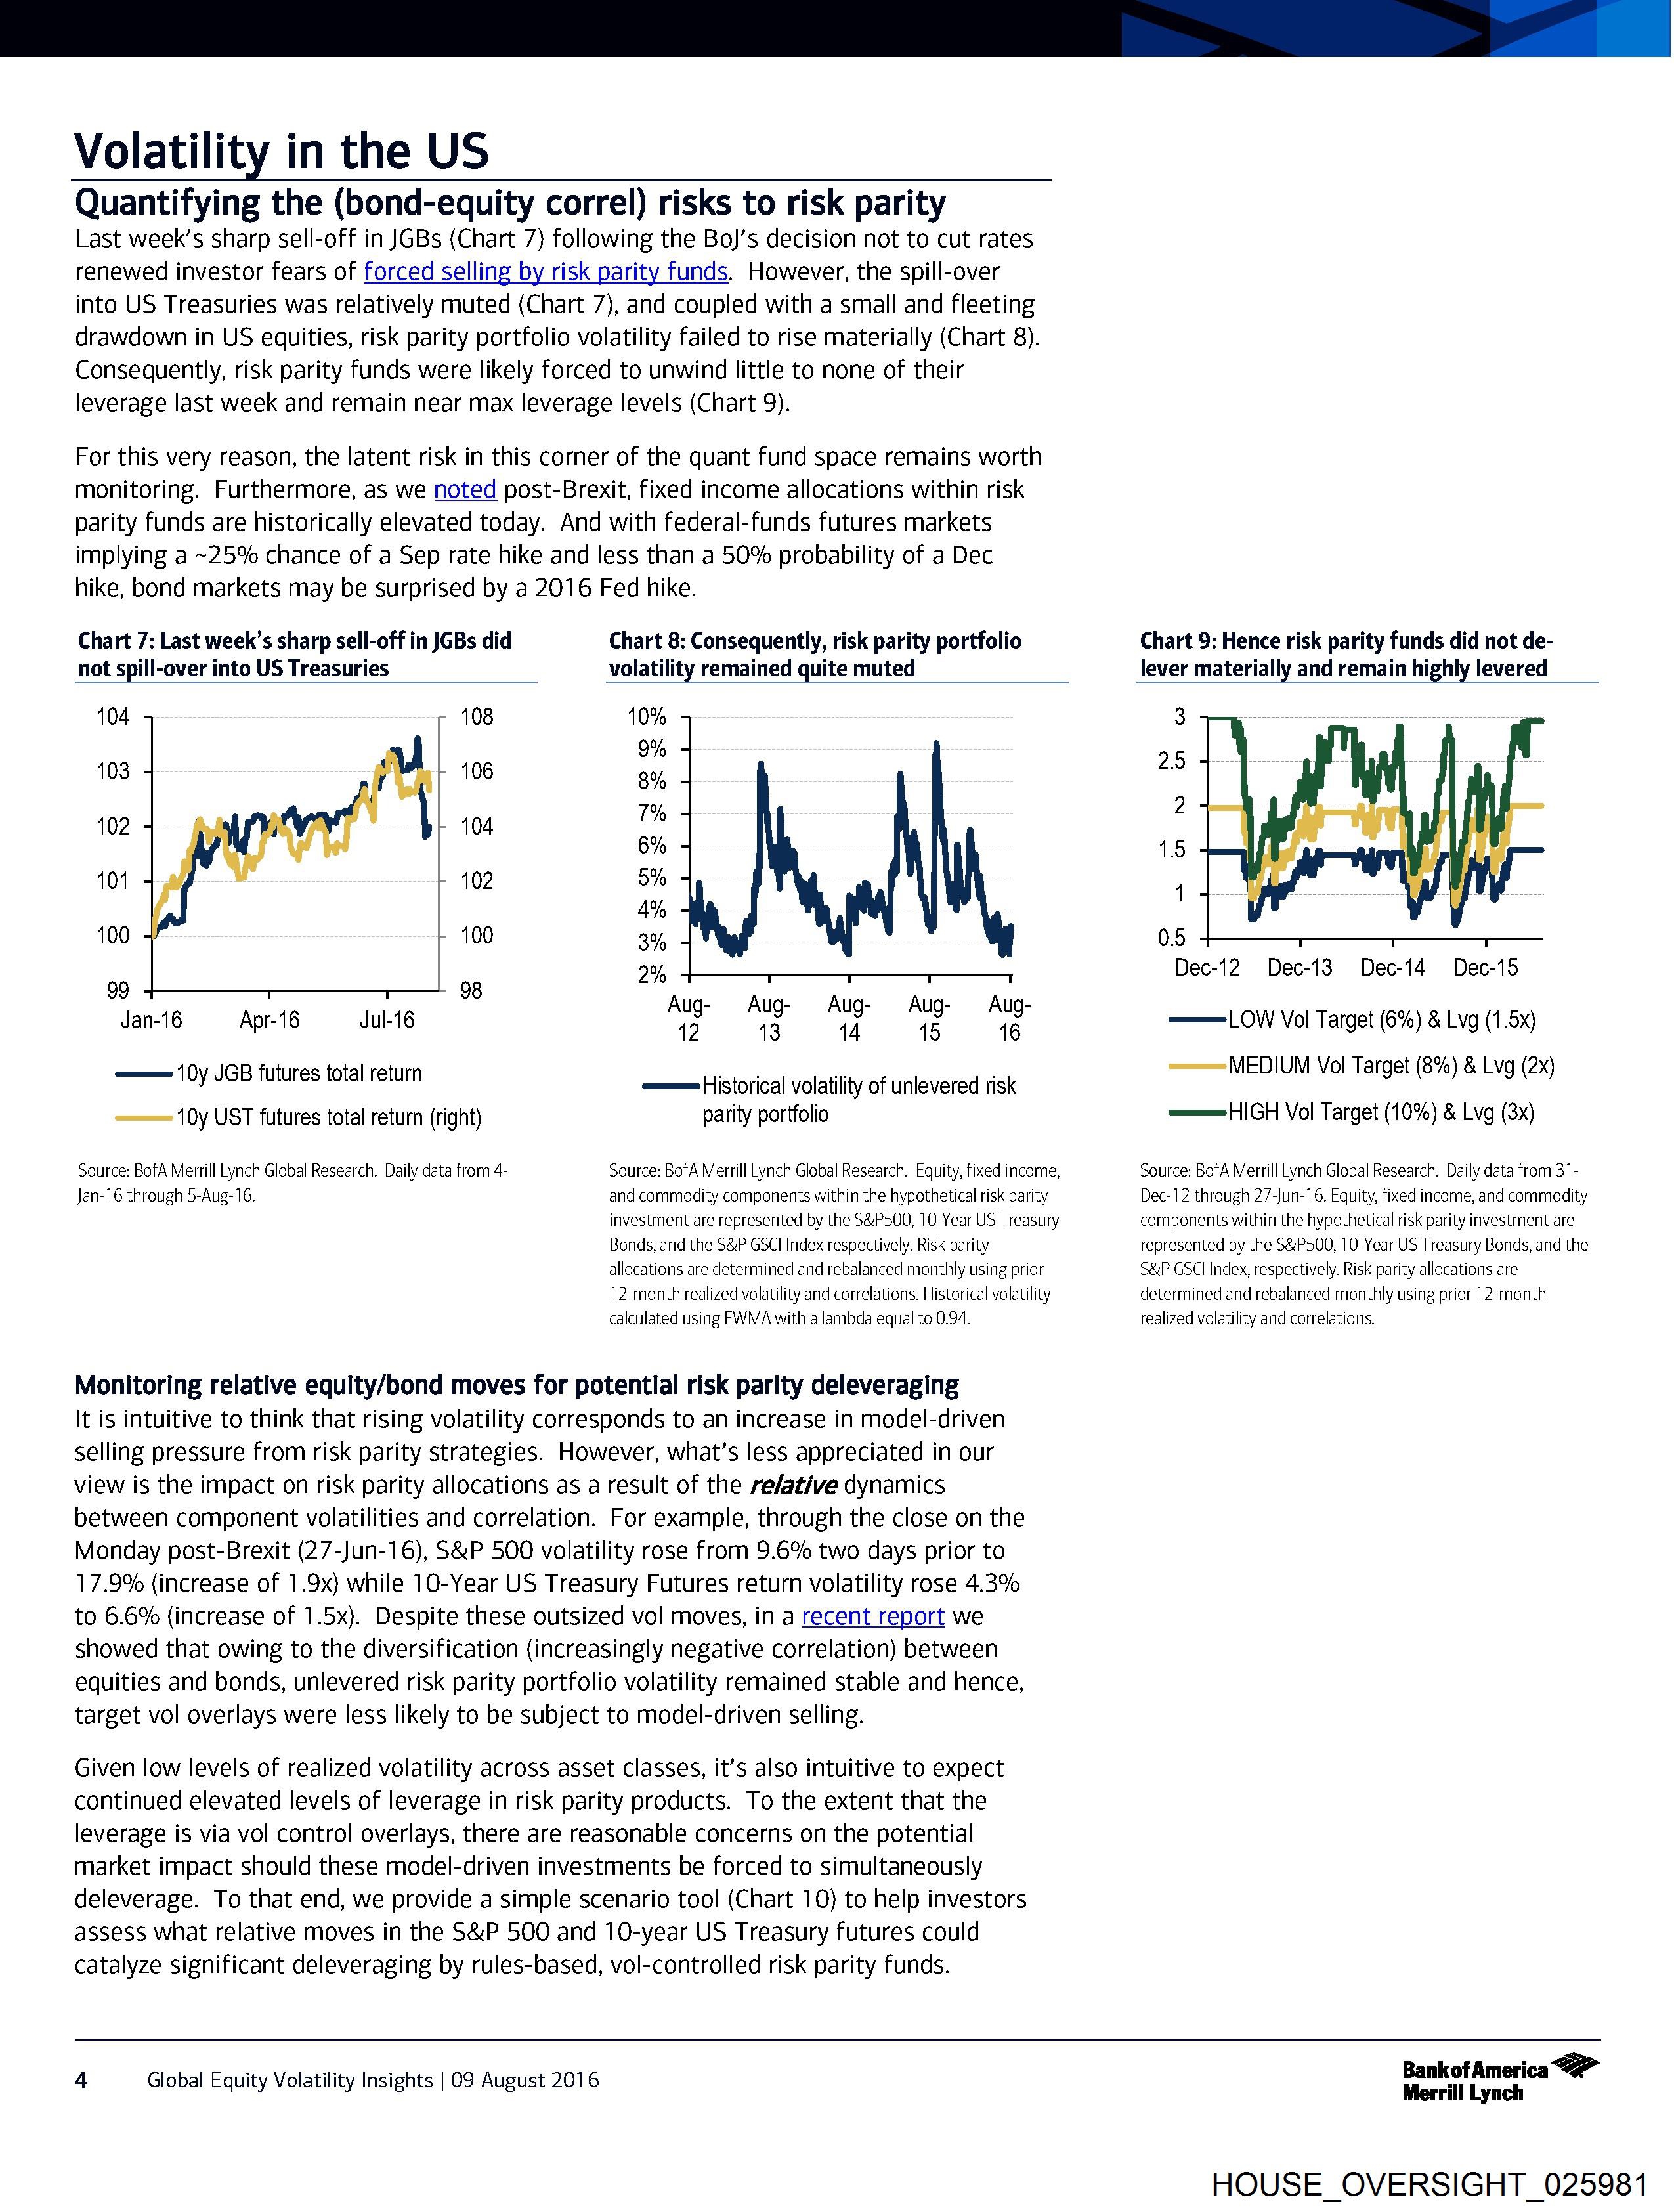
Last week’s sharp sell-off in JGBs (Chart 7) following the Bo)’s decision not to cut rates
renewed investor fears of forced selling by risk parity funds. However, the spill-over
into US Treasuries was relatively muted (Chart 7), and coupled with a small and fleeting
drawdown in US equities, risk parity portfolio volatility failed to rise materially (Chart 8).
Consequently, risk parity funds were likely forced to unwind little to none of their
leverage last week and remain near max leverage levels (Chart 9).
For this very reason, the latent risk in this corner of the quant fund space remains worth
monitoring. Furthermore, as we noted post-Brexit, fixed income allocations within risk
parity funds are historically elevated today. And with federal-funds futures markets
implying a ~25% chance of a Sep rate hike and less than a 50% probability of a Dec
hike, bond markets may be surprised by a 2016 Fed hike.
Chart 7: Last week’s sharp sell-off in JGBs did Chart 8: Consequently, risk parity portfolio
not spill-over into US Treasuries volatility remained quite muted
104 108 10%
4 4 9%
03 06 8%
102 104 i
6%
101 102 5%
4%
100 100 3%
9,
99 98 aie
Aug- Aug- Aug- Aug- Aug-
Jan-16 — Apr-16 Jul-16 42 13 14 15 16
‘pall STS deren =——=Historical volatility of unlevered risk
10y UST futures total return (right) parity portfolio
Source: BofA Merrill Lynch Global Research. Daily data from 4- Source: BofA Merrill Lynch Global Research. Equity, fixed income,
Jan-16 through 5-Aug- 16. and commodity components within the hypothetical risk parity
investment are represented by the S&P500, 10-Year US Treasury
Bonds, and the S&P GSCI Index respectively. Risk parity
allocations are determined and rebalanced monthly using prior
]2-month realized volatility and correlations. Historical volatility
calculated using EWMA with a lambda equal to 0.94.
Monitoring relative equity/bond moves for potential risk parity deleveraging
It is intuitive to think that rising volatility corresponds to an increase in model-driven
selling pressure from risk parity strategies. However, what’s less appreciated in our
view is the impact on risk parity allocations as a result of the re/ative dynamics
between component volatilities and correlation. For example, through the close on the
Monday post-Brexit (27-Jun-16}, S&P 500 volatility rose from 9.6% two days prior to
17.9% (increase of 1.9x) while 10-Year US Treasury Futures return volatility rose 4.3%
to 6.6% (increase of 1.5x). Despite these outsized vol moves, in a recent report we
showed that owing to the diversification (increasingly negative correlation) between
equities and bonds, unlevered risk parity portfolio volatility remained stable and hence,
target vol overlays were less likely to be subject to model-driven selling.
Given low levels of realized volatility across asset classes, it’s also intuitive to expect
continued elevated levels of leverage in risk parity products. To the extent that the
leverage is via vol control overlays, there are reasonable concerns on the potential
market impact should these model-driven investments be forced to simultaneously
deleverage. To that end, we provide a simple scenario tool (Chart 10) to help investors
assess what relative moves in the S&P 500 and 10-year US Treasury futures could
catalyze significant deleveraging by rules-based, vol-controlled risk parity funds.
Chart 9: Hence risk parity funds did not de-
lever materially and remain highly levered
Dec-12 Dec-13 Dec14 Dec-15
——=LOW Vol Target (6%) & Lvg (1.5x)
=——=MEDIUM Vol Target (8%) & Lvg (2x)
=——=HIGH Vol Target (10%) & Lvg (3x)
Source: BofA Merrill Lynch Global Research. Daily data from 31-
Dec-12 through 27-Jun-16. Equity, fixed income, and commodity
components within the hypothetical risk parity investment are
represented by the S&P500, 10-Year US Treasury Bonds, and the
S&P GSCI Index, respectively. Risk parity allocations are
determined and rebalanced monthly using prior 12-month
realized volatility and correlations.
4 Global Equity Volatility Insights | O09 August 2016
BankofAmerica <2”
Merrill Lynch
HOUSE_OVERSIGHT_025981
Document Preview

Click to view full size
Document Details
| Filename | HOUSE_OVERSIGHT_025981.jpg |
| File Size | 0.0 KB |
| OCR Confidence | 85.0% |
| Has Readable Text | Yes |
| Text Length | 4,205 characters |
| Indexed | 2026-02-04T16:58:09.957784 |