HOUSE_OVERSIGHT_025996.jpg
Extracted Text (OCR)
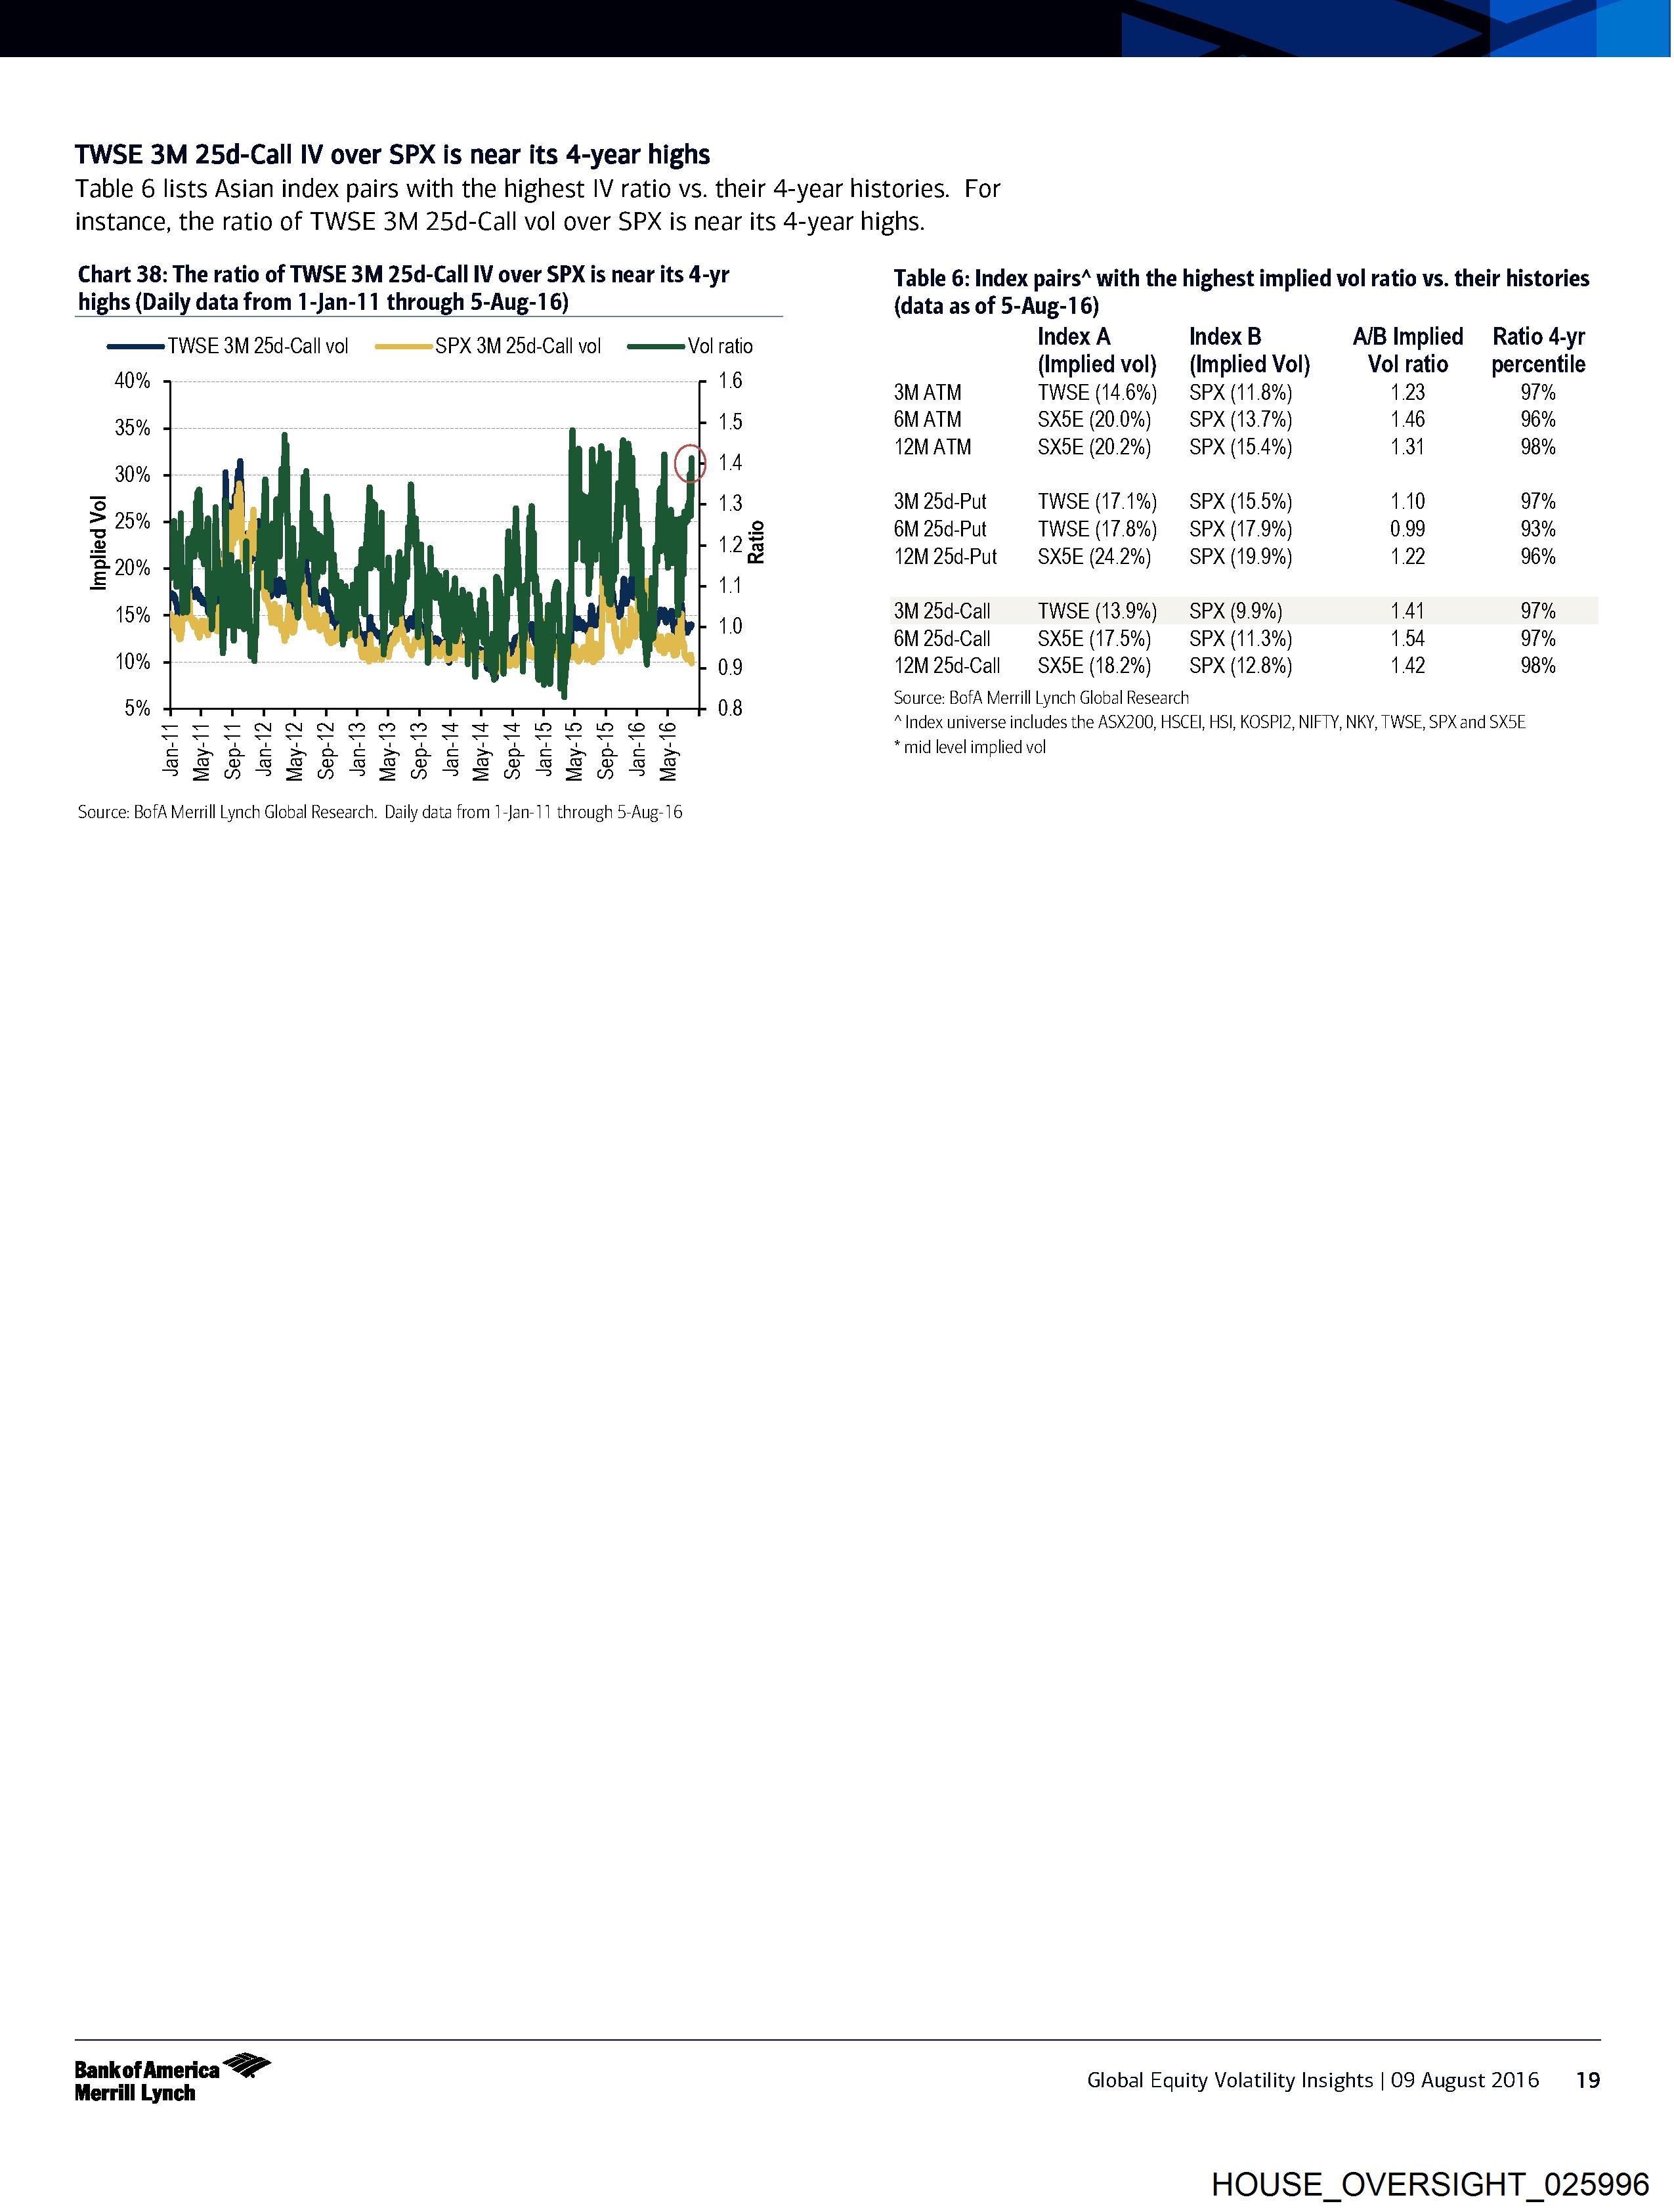
TWSE 3M 25d-Call IV over SPX is near its 4-year highs
Table 6 lists Asian index pairs with the highest IV ratio vs. their 4-year histories. For
instance, the ratio of TWSE 3M 25d-Call vol over SPX is near its 4-year highs.
Chart 38: The ratio of TWSE 3M 25d-Call IV over SPX is near its 4-yr
highs (Daily data from 1-Jan-11 through 5-Aug-16)
Table 6: Index pairs’ with the highest implied vol ratio vs. their histories
(data as of 5-Aug-16)
——WSE 3M 25d-Call vol ~-———=SPX 3M 25d-Call vol ———=Vol ratio Index A Index B AIB Implied Ratio 4-yr
A09% (Implied vol} (Implied Vol} Volratio —_ percentile
° 3M ATM TWSE (14.6%) SPX (11.8% 23 97%
35% 6M ATM SXBE (20.0%) SPX (13.7% 46 96%
12M ATM SX5E (20.2%) SPX (15.4% 31 98%
30%
s 5 3M 25d-Put TWSE (17.1%) = SPX (15.5% 10 97%
3 20% 6M 25d-Put TWSE (17.8%) SPX (17.9% 0.99 93%
e909; 12M 25c-Put SX5E (24.2%) SPX (19.9% 22 96%
E ‘0
15% 4 3M 25d-Call TWSE (13.9%) SPX (9.9%) A 97%
6M 25d-Call SX5E (17.5%) SPX (11.3% 54 97%
10% 12M 25d-Call SX5E (18.2%) SPX (12.8% A? 98%
5% Source: BofA Merrill Lynch Global Research
° —- rer NNnNmMmmrmtttnwMnnwMono * Index universe includes the ASX200, HSCEI, HSI, KOSPI2, NIFTY, NKY, TWSE, SPX and SX5E
¢xda ce A eC HRA dE HoA te HAY SH * mid level implied vol
o FC OD o © oo © © o o ©
PSN FS YNOFSESMOFSEMNWFEYNFGDE
Source: BofA Merrill Lynch Global Research. Daily data from 71-Jan-11 through 5-Aug-16
Bankof America
Merrill Lynch
Global Equity Volatility Insights | O09 August 2016
HOUSE_OVERSIGHT_025996
19
Document Preview

Click to view full size
Document Details
| Filename | HOUSE_OVERSIGHT_025996.jpg |
| File Size | 0.0 KB |
| OCR Confidence | 85.0% |
| Has Readable Text | Yes |
| Text Length | 1,502 characters |
| Indexed | 2026-02-04T16:58:11.012521 |