HOUSE_OVERSIGHT_025991.jpg
Extracted Text (OCR)
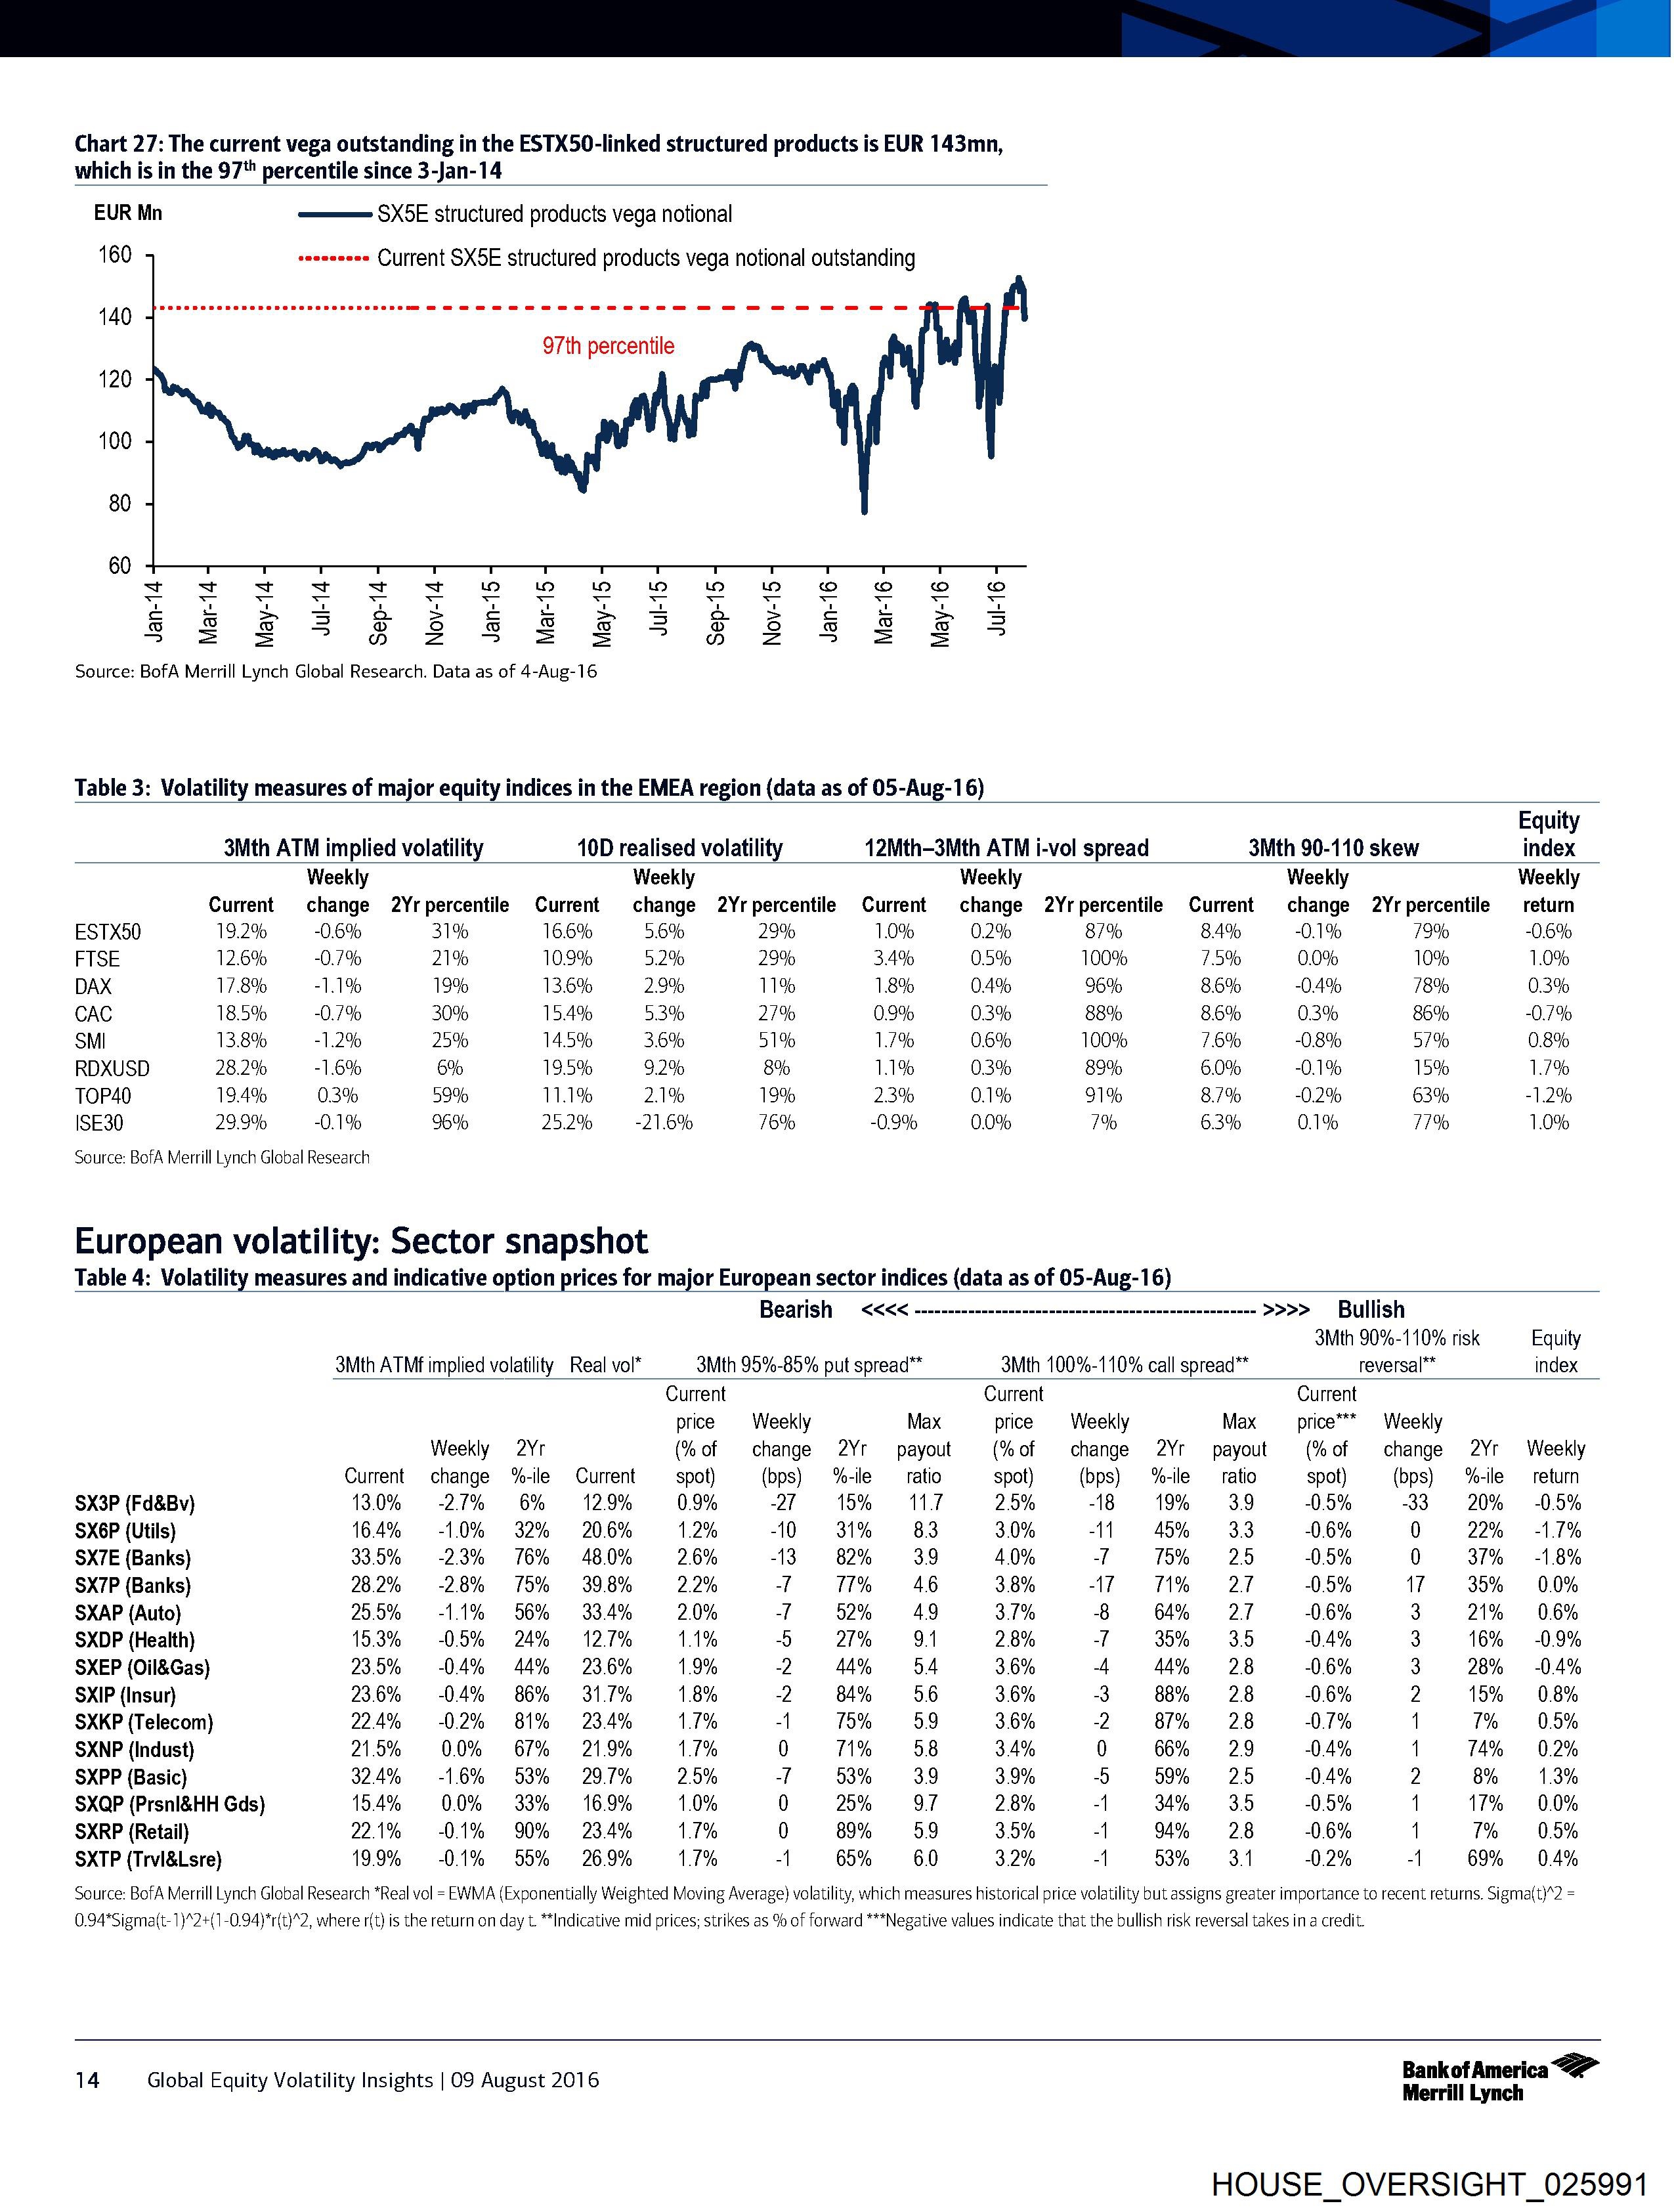
Chart 27: The current vega outstanding in the ESTX50-linked structured products is EUR 143mn,
which is in the 97" percentile since 3-Jan-14
EUR Mn SX5E structured products vega notional
160 7 an enanene Current SX5E structured products vega notional outstanding
44g. proctitis eee eee ee ceeeeeee eee een ne
97th percentile
120
100
80
60
+ s+ + s+ + + Ke) Ke) Ww Ww Ww WwW oO io) oO oO
2535253 235 28823
Source: BofA Merrill Lynch Global Research. Data as of 4-Aug-16
Table 3: Volatility measures of major equity indices in the EMEA region (data as of 05-Aug-16)
Equity
3Mth ATM implied volatility 10D realised volatility {2Mth-3Mth ATM i-vol spread 3Mth 90-110 skew index
Weekly Weekly Weekly Weekly Weekly
Current change 2Yrpercentile Current change 2Yrpercentile Current change 2Yrpercentile Current change 2Yrpercentile return
ESTX50 19.2% -0.6% 31% 16.6% 5.6% 29% 1.0% 0.2% 87% 8.4% 0.1% 79% 0.6%
FTSE 12.6% -0.7% 21% 10.9% 5.2% 29% 3.4% 0.5% 100% 7.5% 0.0% 10% 1.0%
DAX 17.8% -1.1% 19% 13.6% 2.9% 11% 1.8% 0.4% 96% 8.6% 0.4% 78% 0.3%
CAC 18.5% -0.7% 30% 15.4% 5.3% 27% 0.9% 0.3% 88% 8.6% 0.3% 86% 0.7%
SMI 13.8% -1.2% 25% 14.5% 3.6% 51% 1.7% 0.6% 100% 7.6% 0.8% 57% 0.8%
RDXUSD 28.2% -1.6% 6% 19.5% 9.2% 8% 1.1% 0.3% 89% 6.0% 0.1% 15% 1.7%
TOP40 19.4% 0.3% 59% 11.1% 2.1% 19% 23% 0.1% 91% 8.7% 0.2% 63% -1.2%
ISE30 29.9% 0.1% 96% 25.2% -21.6% 76% -0,9% 0.0% 7% 6.3% 0.1% 77% 1.0%
Source: BofA Merrill Lynch Global Research
European volatility: Sector snapshot
Table 4: Volatility measures and indicative option prices for major European sector indices (data as of 05-Aug-16)
Bearish — <<<< --------------------nnecnnnnecnnenncnnencnnnnnnns >>>> Bullish
3Mth 90%-110% risk Equity
3Mth ATM implied volatility Real vol* 3Mth 95%-85% put spread** 3Mth 100%-110% call spread** reversal™™ index
Current Current Current
price Weekly Max price Weekly Max price™* Weekly
Weekly 2Yr (%of change 2Yr payout (%of change 2Yr payout (%of change 2Yr Weekly
Current change %-ile Current spot) (bps) %-ile ratio spot) (bps) %-ile — ratio spot) (bps) %-ile — return
SX3P (Fd&Bv) 13.0% 27% 6% 12.9% 0.9% 27 15%) = NT 2.5% -18 19% 39 0.5% 33 20% = -0.5%
SX6P (Utils) 164% -10% 32% 20.6% 1.2% -10 31% 83 3.0% -11 45% 3.3 -0.6% 0 22% = -1.1%
SX7E (Banks) 33.5% -23% 16% 48.0% 2.6% -13. 82% 3.9 4.0% -T 15% 25 0.5% 0 37% = -1.8%
SX7P (Banks) 28.2% -2.8% 15% 39.8% 2.2% -T 1% 46 3.8% 7 11% = 27 -0.5% 7 35% 0.0%
SXAP (Auto) 25.5% -1.1% 56% 33.4% 2.0% -T 52% 49 3.7% 8 64% 27 -0.6% 3 21% 0.6%
SXDP (Health) 15.3% 05% 24% 12.7% A% 5 27% 9.1 2.8% -T 35% 3.5 0.4% 3 16% -0.9%
SXEP (Oil&Gas) 23.5% 04% 44% 23.6% 9% -2 44% 54 3.6% 4 44% = 2.8 -0.6% 3 28% -0.4%
SXIP (Insur) 23.6% 04% 86% 31.7% 8% -2 84% 5.6 3.6% 3 88% 28 -0.6% 2 15% 0.8%
SXKP (Telecom) 224% = =-0.2% 81% 234% 1% -{ 15% 5.9 3.6% -2 87% 828 0.7% 1 1% 0.5%
SXNP (Indust) 21.5% 0.0% 67% 21.9% 1% 0 M% 58 3.4% 0 66% 29 0.4% 1 14% = 0.2%
SXPP (Basic) 32.4% -1.6% 58% 29.7% 2.5% 1 53% 3.9 3.9% 5 59% 25 0.4% 2 8% 1.3%
SXQP (Prsnl&HH Gds) 154% 0.0% 33% 16.9% 0% 0 25% 97 2.8% -{ 34% 3.5 0.5% 1 17% 0.0%
SXRP (Retail) 22.1% -0.1% 90% 23.4% 1% 0 89% 5.9 3.5% -{ 94% 28 -0.6% 1 T% 0.5%
SXTP (Trvl&Lsre) 199% 01% 55% 26.9% 1% -{ 65% 6.0 3.2% -{ 53% «3.1 0.2% -1 69% 04%
Source: BofA Merrill Lynch Global Research *Real vol = EWMA (Exponentially Weighted Moving Average) volatility, which measures historical price volatility but assigns greater importance to recent returns. Sigma(t)*2 =
0.94*Sigma(t- 1)*2+(1-0.94)*r(t}*2, where r(t) is the return on day t. “Indicative mid prices; strikes as % of forward ***Negative values indicate that the bullish risk reversal takes in a credit.
BankofAmerica <2”
14 Global Equity Volatility Insights | O09 August 2016 Merrill Lynch
HOUSE_OVERSIGHT_025991
Document Preview

Click to view full size
Document Details
| Filename | HOUSE_OVERSIGHT_025991.jpg |
| File Size | 0.0 KB |
| OCR Confidence | 85.0% |
| Has Readable Text | Yes |
| Text Length | 3,741 characters |
| Indexed | 2026-02-04T16:58:11.180896 |