HOUSE_OVERSIGHT_026968.jpg
Extracted Text (OCR)
Investment Gold man
Management
Important Information Division
Performance / Estimated Income / Estimated Cash Flow. Past performance is not a guide of future results and may include investments no longer owned in current or closed accounts. Current
performance may be lower or higher than the performance data quoted. To request the most current or historical performance data, or asset classification schema information, please contact your
PWM team at the number provided on your monthly statement or toll-free in the U.S. at 1-800-323-5678. Performance reports, where shown, generally present the relevant time weighted
performance, which is a combination of daily returns compounded over a specified time period with the removal of the deposit and withdrawal impacts, and may show internal rate of return
calculations where requested. Aggregate performance may not equal the sum of returns at an investment level. Performance for advisory accounts is currently calculated net of any management fees
and might include investments for which actual market prices are not currently available, and does not include private equity positions. Performance for alternative investments is calculated using the
value of the last available partnership capital statement or NAV. If included, estimated income figures and estimated private equity future cash flows are estimates of future activity, and actual results
may vary substantially. GS&Co. has adjusted performance calculations for certain asset classes or strategies and may do so in the future. Performance of net cash (i.e., cash less margin debit) is
generally included in the total performance calculation but not displayed separately. Option performance is included in the performance of the asset class of the underlier. Margin loans are generally
excluded from advisory performance but included in brokerage performance calculations. Mutual fund and ETF investment returns and the principal value of your investment will fluctuate. As a result,
your shares when redeemed may be worth more or less than their original cost. The performance data for ETFs does not reflect a deduction for commissions that would reduce the displayed
performance. You are not subject to a sales charge for mutual funds purchased through PWM. If a sales charge were applicable, the sales charge would reduce the mutual fund’s performance.
Information on our asset classification schema is available upon request. Generally, total returns are pre-tax and are calculated using daily time-weighted returns in which cash and securities
deposits are attributed to the beginning of the day and cash and securities withdrawals are attributed to the end of the day.
Indices / Benchmarks. Any references to indices, benchmarks, or other measure of relative market performance over a specified period of time are provided for your information only and is not
indicative of future results. In addition to the benchmark assigned to a specific investment strategy, other benchmarks (“Comparative Benchmarks”) may be displayed, including ones displayed at your
request. Managers may not review the performance of your account against the performance of Comparative Benchmarks. There is no guarantee that performance will equal or exceed any
benchmark displayed. Where a benchmark for a strategy has changed, the historical benchmark(s) are available upon request. Inception to date (“ITD”) returns and benchmark / reference portfolio
returns may reflect different periods. ITD returns for accounts or asset classes only reflect performance during periods in which your account(s) held assets and / or were invested in the asset class.
The benchmark or reference portfolio returns shown reflect the benchmark / portfolio performance from the date of inception of your account or your initial investment in the asset class. If displayed,
estimated income figures are estimates of future activity obtained from third party sources.
Indices are unmanaged. The figures for the index reflect the reinvestment of all income or dividends, as applicable, but do not reflect the deduction of any fees or expenses which would reduce
returns. Investors cannot invest directly in indices. Where appropriate, relevant index trademarks or index information has been licensed or sub-licensed for use. Inclusion of index information is not
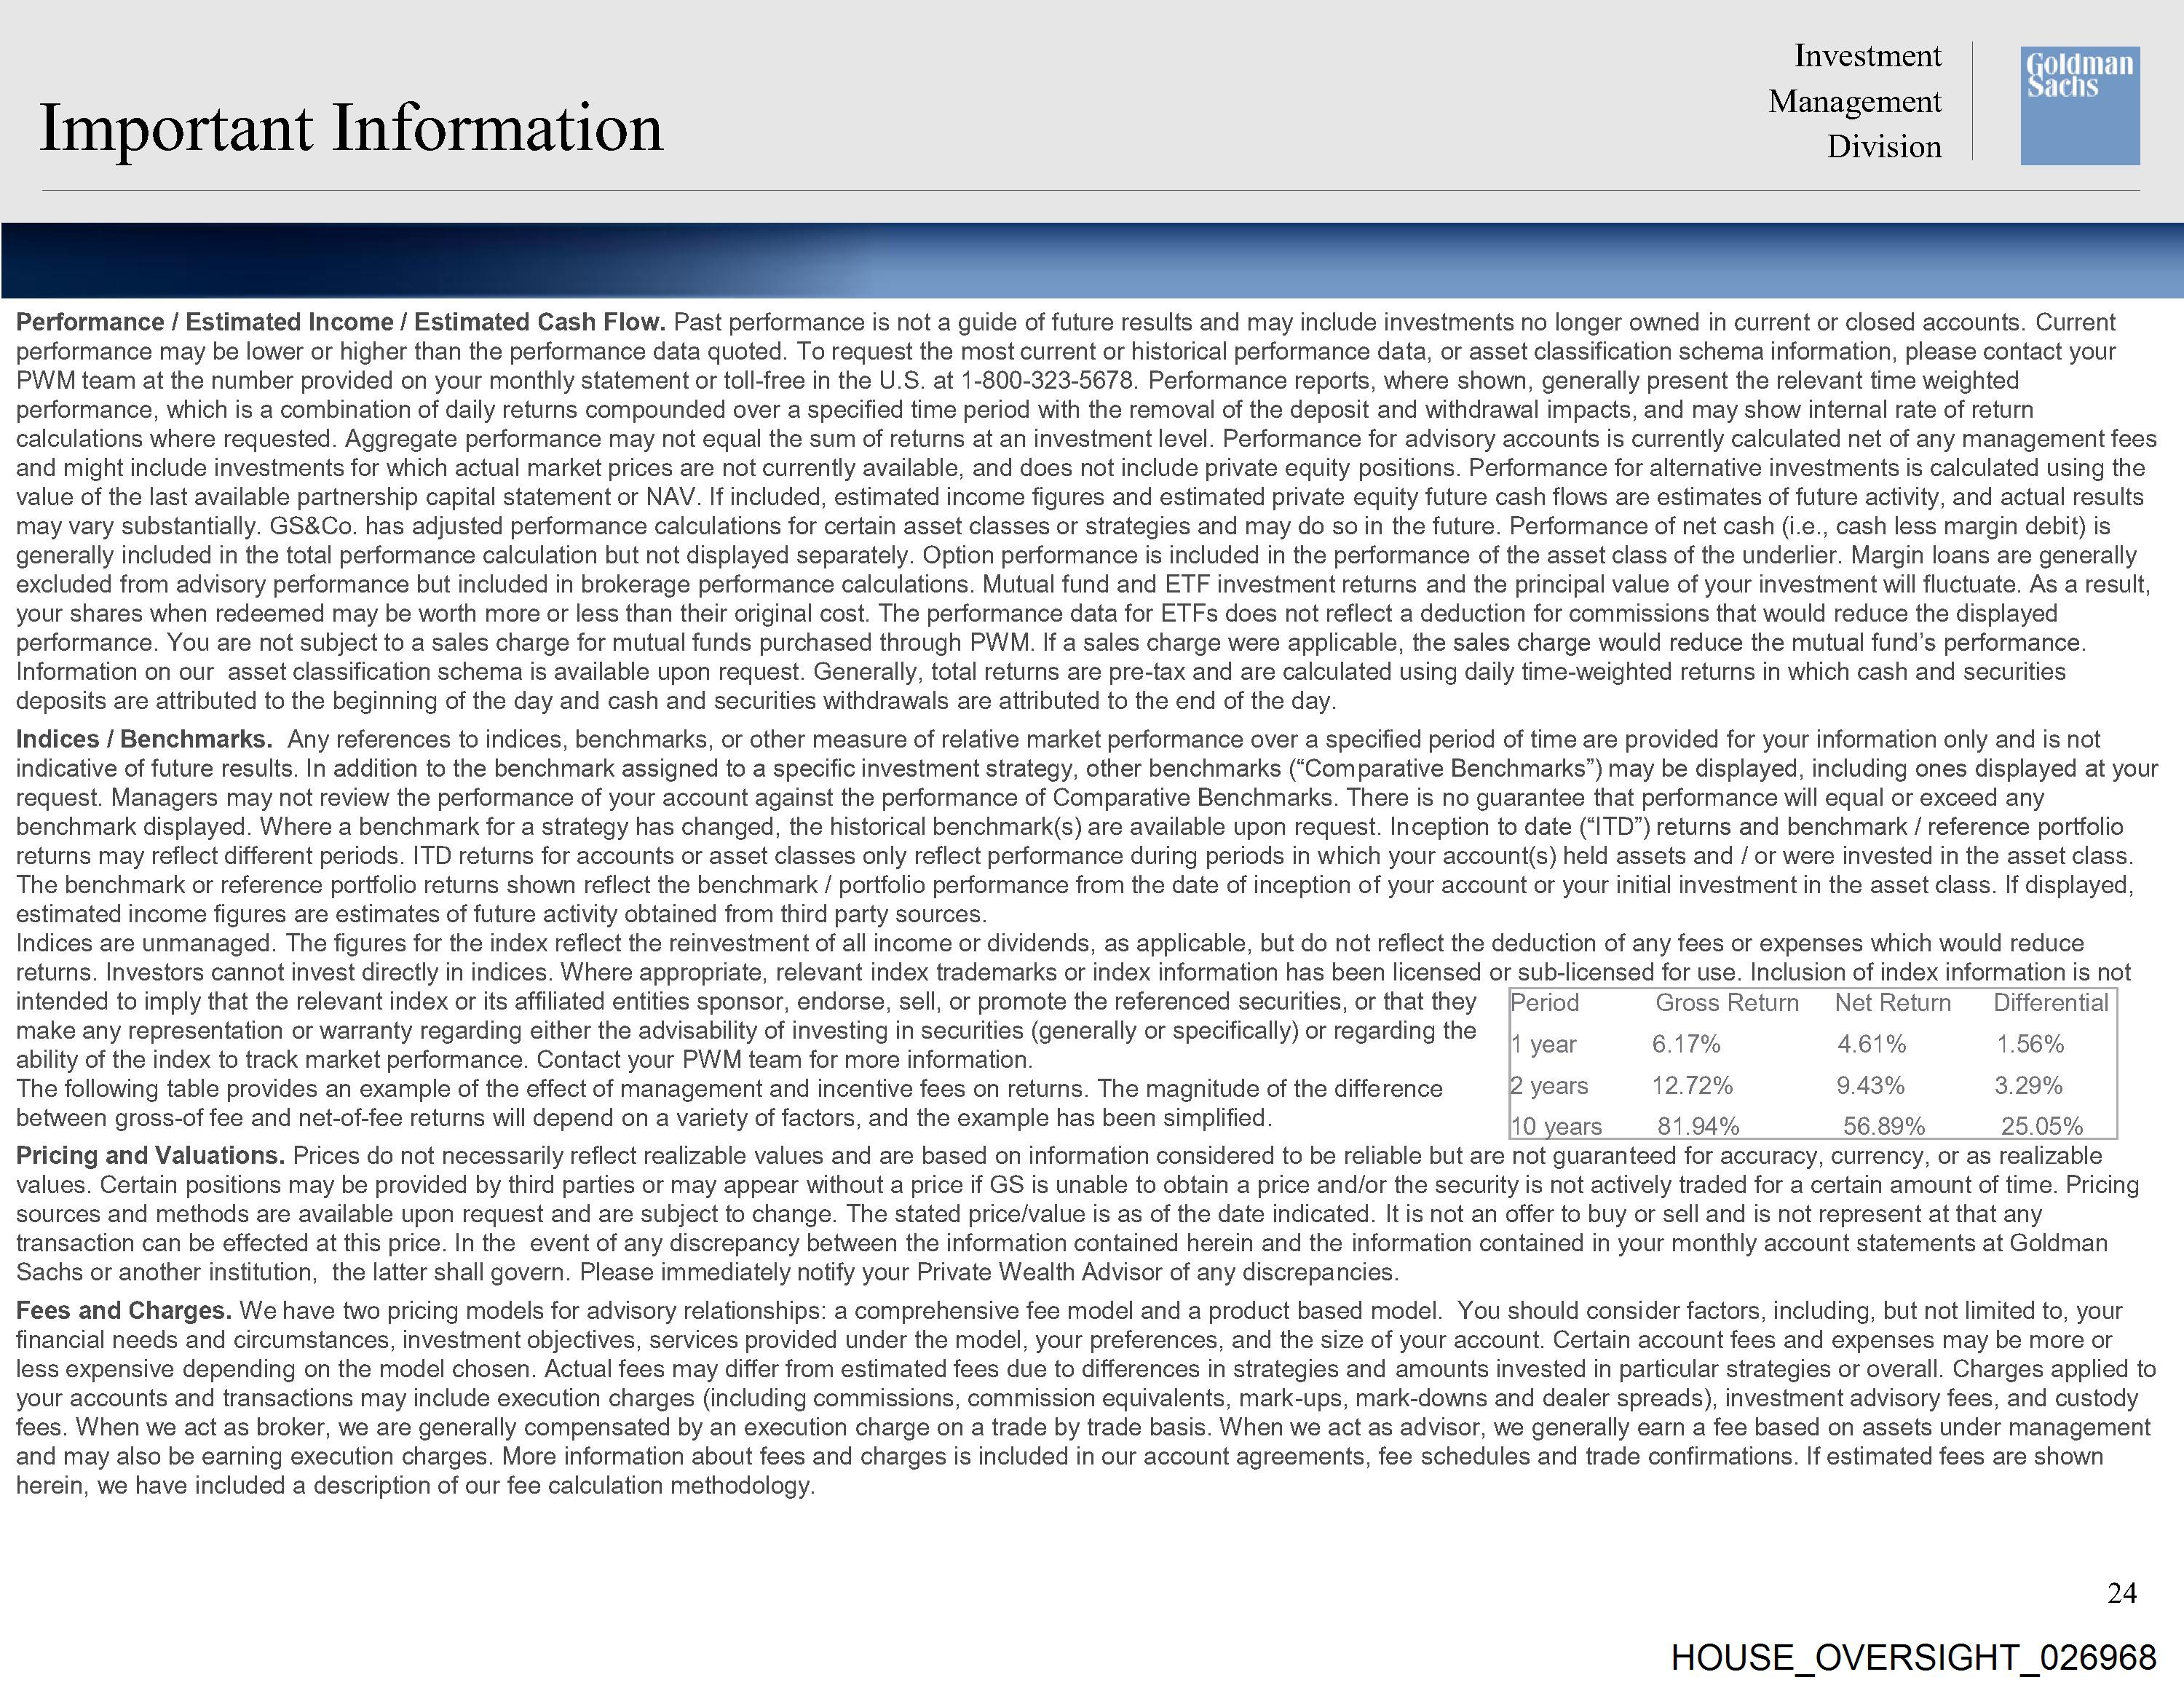
intended to imply that the relevant index or its affiliated entities sponsor, endorse, sell, or promote the referenced securities, or that they Period Gross Return Net Return _ Differential
make any representation or warranty regarding either the advisability of investing in securities (generally or specifically) or regarding the
| 0, Q, G,
ability of the index to track market performance. Contact your PWM team for more information. | year acl “lM omen
The following table provides an example of the effect of management and incentive fees on returns. The magnitude of the difference 2 years 12.72% 9.43% 3.29%
between gross-of fee and net-of-fee returns will depend on a variety of factors, and the example has been simplified. HO years 81.94% 56.89% 25.05%
Pricing and Valuations. Prices do not necessarily reflect realizable values and are based on information considered to be reliable but are not guaranteed for accuracy, currency, or as realizable
values. Certain positions may be provided by third parties or may appear without a price if GS is unable to obtain a price and/or the security is not actively traded for a certain amount of time. Pricing
sources and methods are available upon request and are subject to change. The stated price/value is as of the date indicated. It is not an offer to buy or sell and is not represent at that any
transaction can be effected at this price. In the event of any discrepancy between the information contained herein and the information contained in your monthly account statements at Goldman
Sachs or another institution, the latter shall govern. Please immediately notify your Private Wealth Advisor of any discrepancies.
Fees and Charges. We have two pricing models for advisory relationships: a comprehensive fee model and a product based model. You should consider factors, including, but not limited to, your
financial needs and circumstances, investment objectives, services provided under the model, your preferences, and the size of your account. Certain account fees and expenses may be more or
less expensive depending on the model chosen. Actual fees may differ from estimated fees due to differences in strategies and amounts invested in particular strategies or overall. Charges applied to
your accounts and transactions may include execution charges (including commissions, commission equivalents, mark-ups, mark-downs and dealer spreads), investment advisory fees, and custody
fees. When we act as broker, we are generally compensated by an execution charge on a trade by trade basis. When we act as advisor, we generally earn a fee based on assets under management
and may also be earning execution charges. More information about fees and charges is included in our account agreements, fee schedules and trade confirmations. If estimated fees are shown
herein, we have included a description of our fee calculation methodology.
24
HOUSE_OVERSIGHT_026968
Document Preview

Click to view full size
Extracted Information
Phone Numbers
Document Details
| Filename | HOUSE_OVERSIGHT_026968.jpg |
| File Size | 0.0 KB |
| OCR Confidence | 85.0% |
| Has Readable Text | Yes |
| Text Length | 7,278 characters |
| Indexed | 2026-02-04T17:00:19.354242 |
Related Documents
Documents connected by shared names, same document type, or nearby in the archive.