HOUSE_OVERSIGHT_021007.jpg
Extracted Text (OCR)
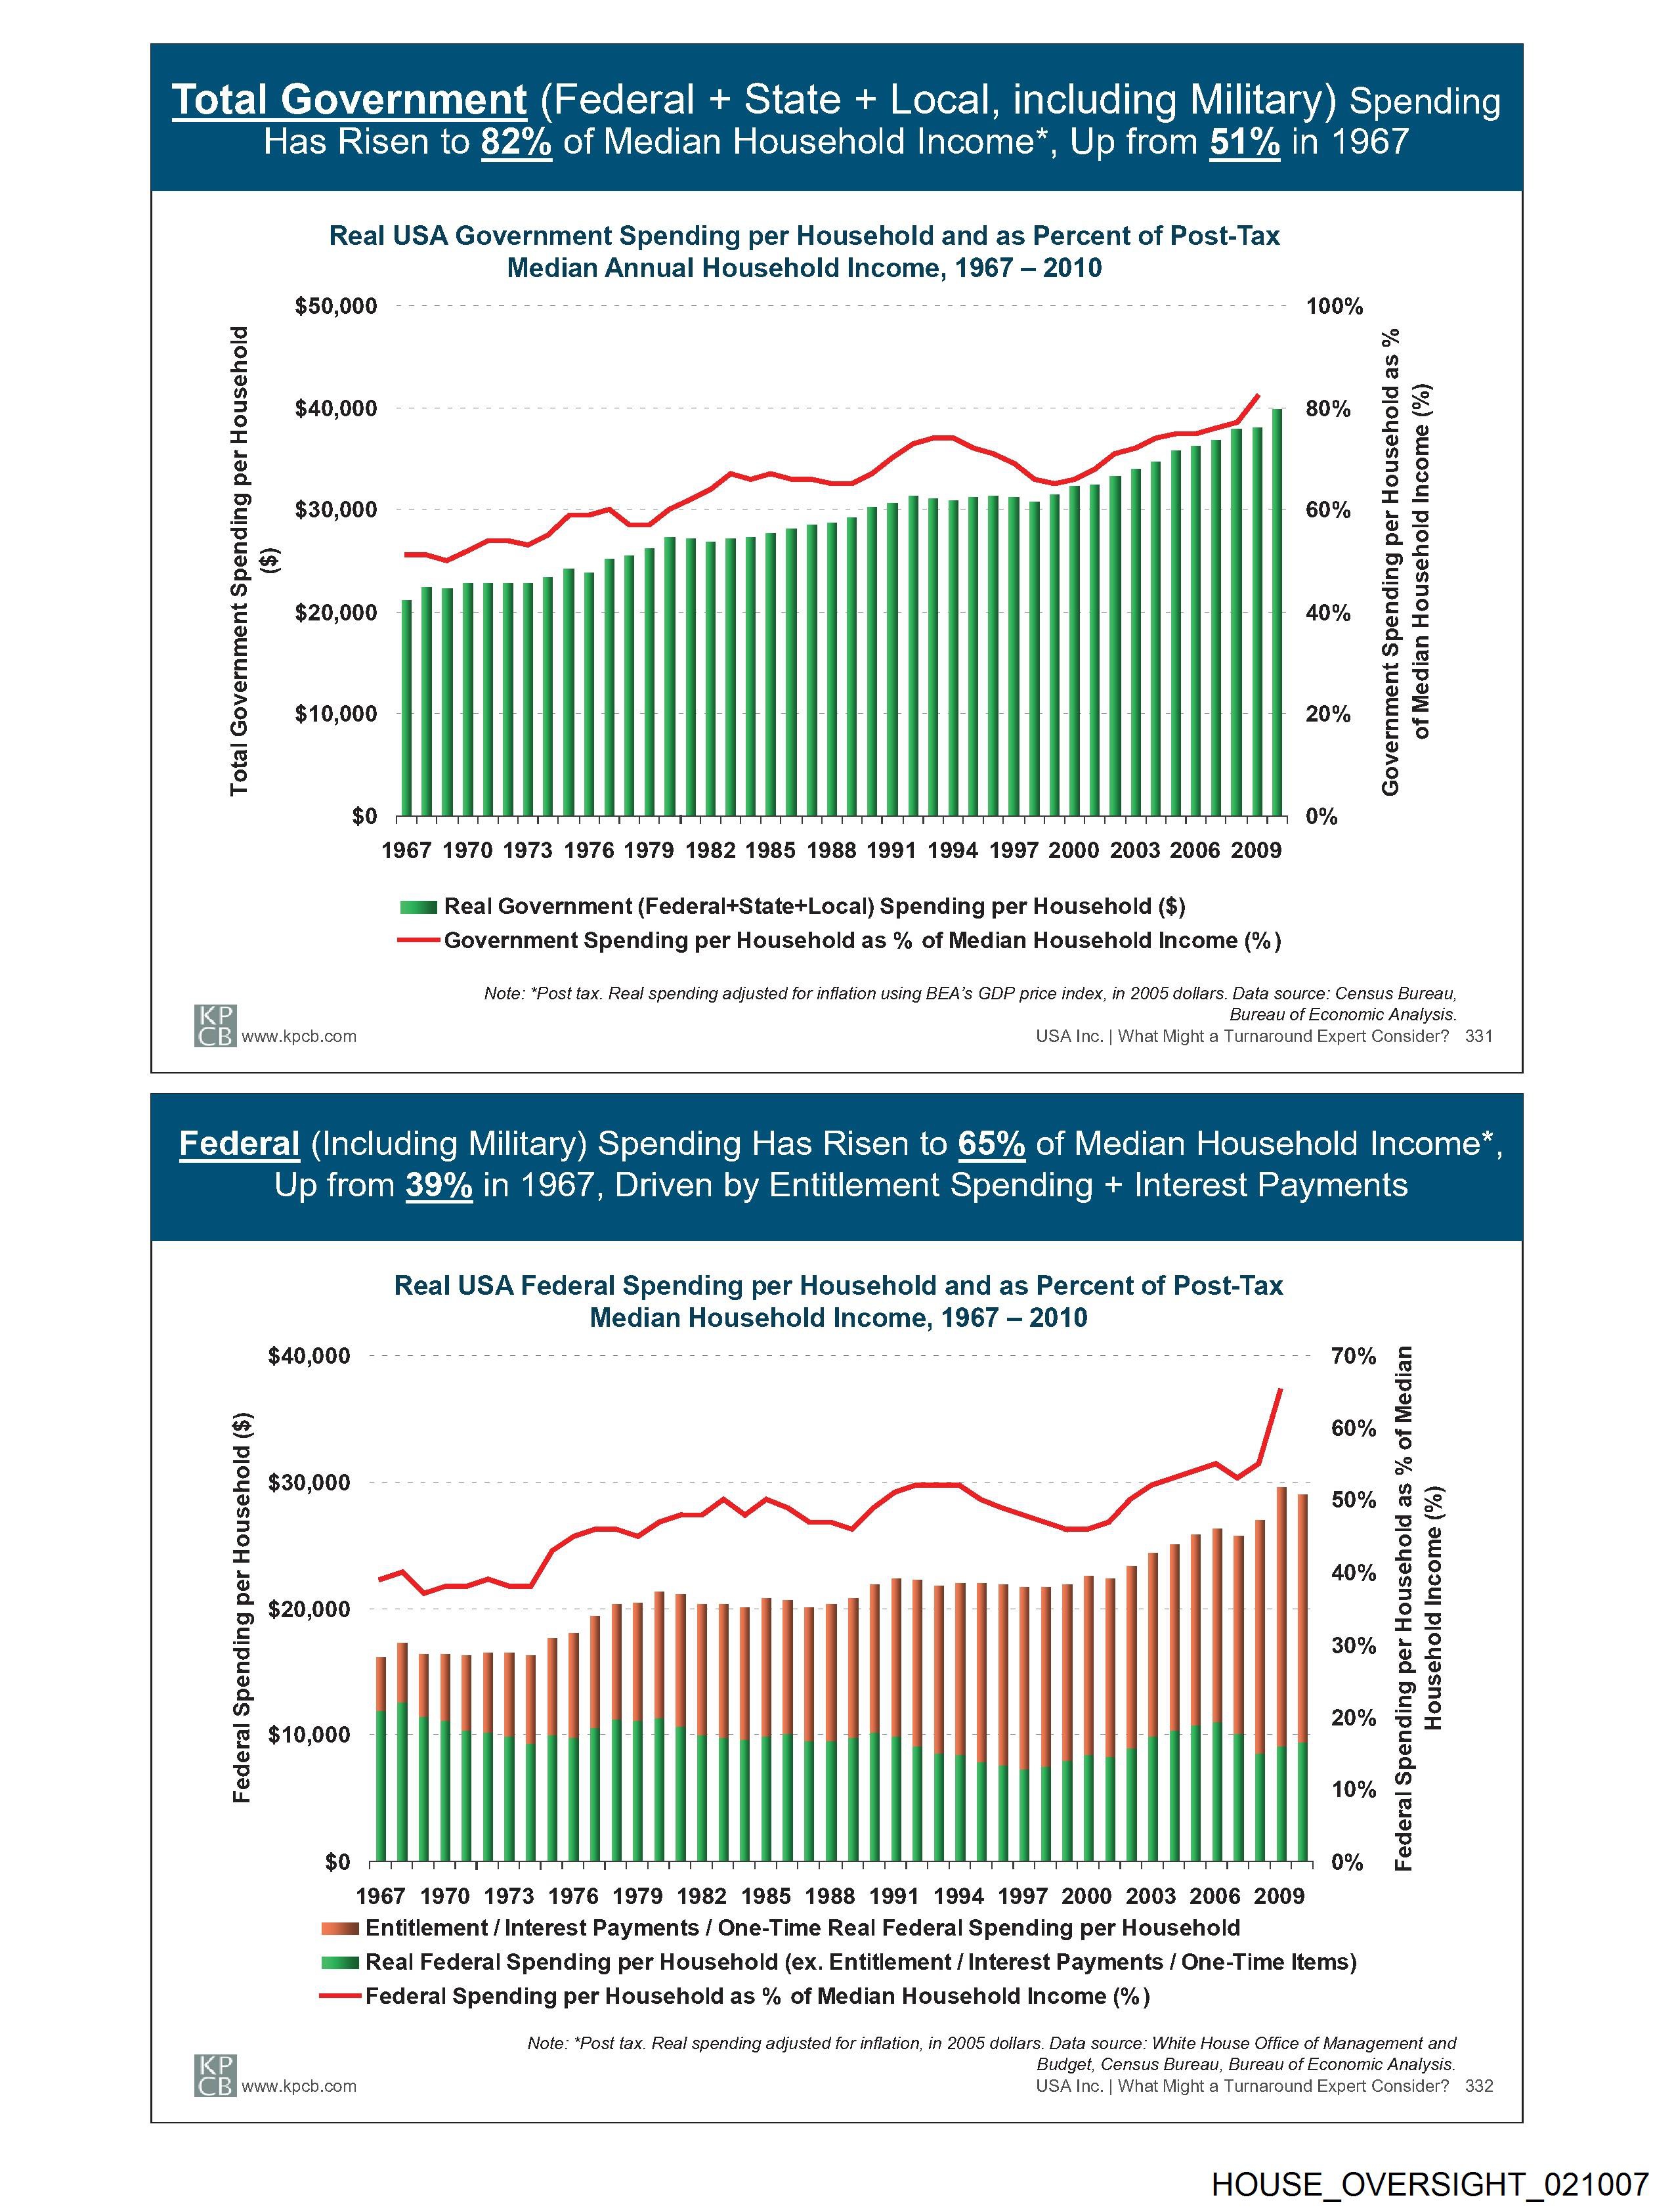
Total Government (Federal + State + Local, including Military) Spending
Has Risen to 82% of Median Household Income”, Up from 51% in 1967
Real USA Government Spending per Household and as Percent of Post-Tax
Median Annual Household Income, 1967 — 2010
$50,000 ----------------- 22-22 ee ee eee eee eee 100%
$40,000
$30,000 60%
$20,000 $i a it JU E EEL sox,
of Median Household Income (%)
$10,000 # i) as tt JEL oon,
Total Government Spending per Household
($)
Government Spending per Household as %
$0 0%
1967 1970 1973 1976 1979 1982 1985 1988 1991 1994 1997 2000 2003 2006 2009
mam Real Government (Federal+State+Local) Spending per Household ($)
—— Government Spending per Household as % of Median Household Income (%)
Note: *Post tax. Real spending adjusted for inflation using BEA’s GDP price index, in 2005 dollars. Data source: Census Bureau,
[= Bureau of Economic Analysis.
(@ 4 www.kpcb.com USA Inc. | What Might a Turnaround Expert Consider? 331
Federal (Including Military) Spending Has Risen to 65% of Median Household Income”,
Up from 39% in 1967, Driven by Entitlement Spending + Interest Payments
Real USA Federal Spending per Household and as Percent of Post-Tax
Median Household Income, 1967 — 2010
$40,000 ----------------- 2-222 e eee eee ee eee ee eee eee ene 70%
60%
$30,000 -------------- <2 - een mg eM -
50%
40%
| ee : 2 E p l | l l Tait l
30%
209
$10,000 - Hil ! a 4 l I i ! ll I WEEE l 1)
10%
$0 T T T T T T T T T 0%
1967 1970 1973 1976 1979 1982 1985 1988 1991 1994 1997 2000 2003 2006 2009
man Entitlement / Interest Payments / One-Time Real Federal Spending per Household
mam Real Federal Spending per Household (ex. Entitlement / Interest Payments / One-Time Items)
—— Federal Spending per Household as % of Median Household Income (%)
Federal Spending per Household ($)
Federal Spending per Household as % of Median
Household Income (%)
Note: *Post tax. Real spending adjusted for inflation, in 2005 dollars. Data source: White House Office of Management and
KP Budget, Census Bureau, Bureau of Economic Analysis.
(@ EB) www.kpcb.com USA Inc. | What Might a Turnaround Expert Consider? 332
HOUSE_OVERSIGHT_021007
Document Preview

Click to view full size
Document Details
| Filename | HOUSE_OVERSIGHT_021007.jpg |
| File Size | 0.0 KB |
| OCR Confidence | 85.0% |
| Has Readable Text | Yes |
| Text Length | 2,169 characters |
| Indexed | 2026-02-04T16:43:21.633463 |
Related Documents
Documents connected by shared names, same document type, or nearby in the archive.