HOUSE_OVERSIGHT_025999.jpg
Extracted Text (OCR)
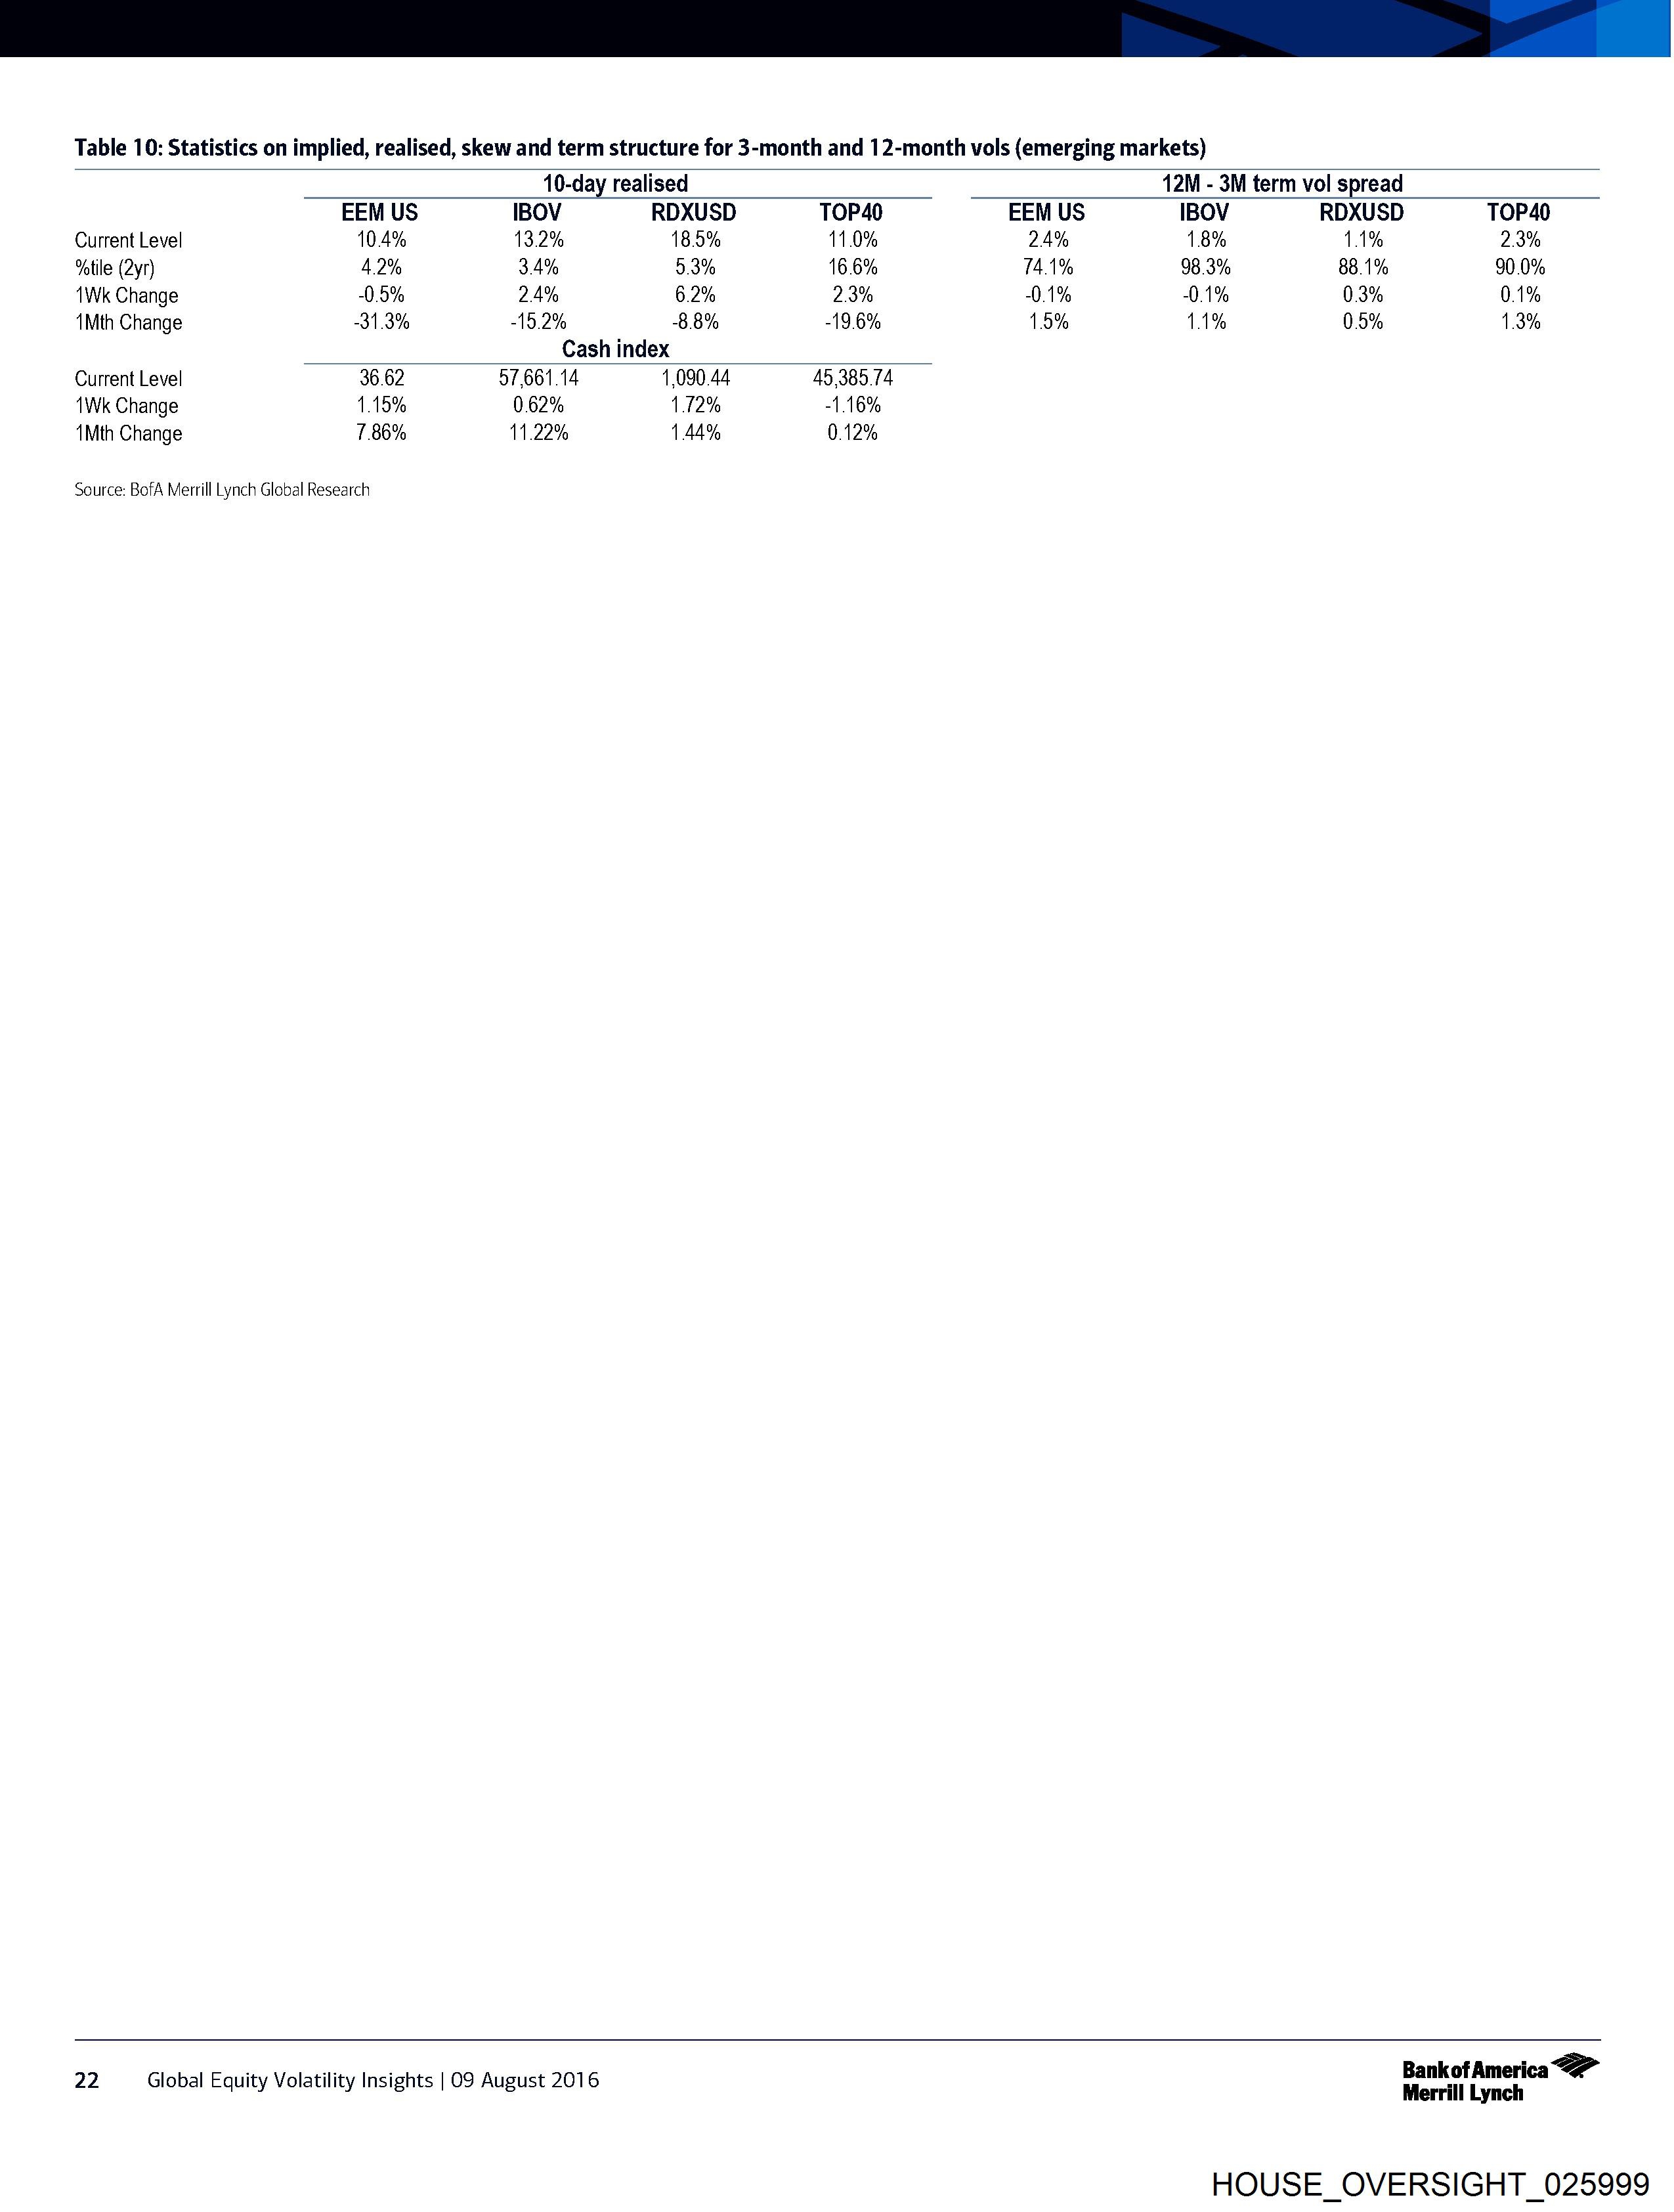
Table 10: Statistics on implied, realised, skew and term structure for 3-month and 12-month vols (emerging markets)
10-day realised 12M - 3M term vol spread
EEM US IBOV RDXUSD TOP40 EEM US IBOV RDXUSD TOP40
Current Level 10.4% 13.2% 18.5% 11.0% 24% 18% 11% 2.3%
%atile (2yr) 4.2% 3.4% 5.3% 16.6% 14.1% 98.3% 88.1% 90.0%
1Wk Change -0.5% 24% 6.2% 2.3% -0.1% -0.1% 0.3% 0.1%
1Mth Change -31.3% -15.2% 8.8% -19.6% 15% 11% 0.5% 1.3%
Cash index
Current Level 36.62 57,661.14 1,090.44 45 385.74
1Wk Change 1.15% 0.62% 1.72% -1.16%
1Mth Change 786% 11.22% 144% 0.12%
Source: BofA Merrill Lynch Global Research
22 Global Equity Volatility Insights | 09 August 2016 (rer teliall
HOUSE_OVERSIGHT_025999
Document Preview

Click to view full size
Document Details
| Filename | HOUSE_OVERSIGHT_025999.jpg |
| File Size | 0.0 KB |
| OCR Confidence | 85.0% |
| Has Readable Text | Yes |
| Text Length | 697 characters |
| Indexed | 2026-02-04T16:58:11.006161 |
Related Documents
Documents connected by shared names, same document type, or nearby in the archive.