HOUSE_OVERSIGHT_025986.jpg
Extracted Text (OCR)
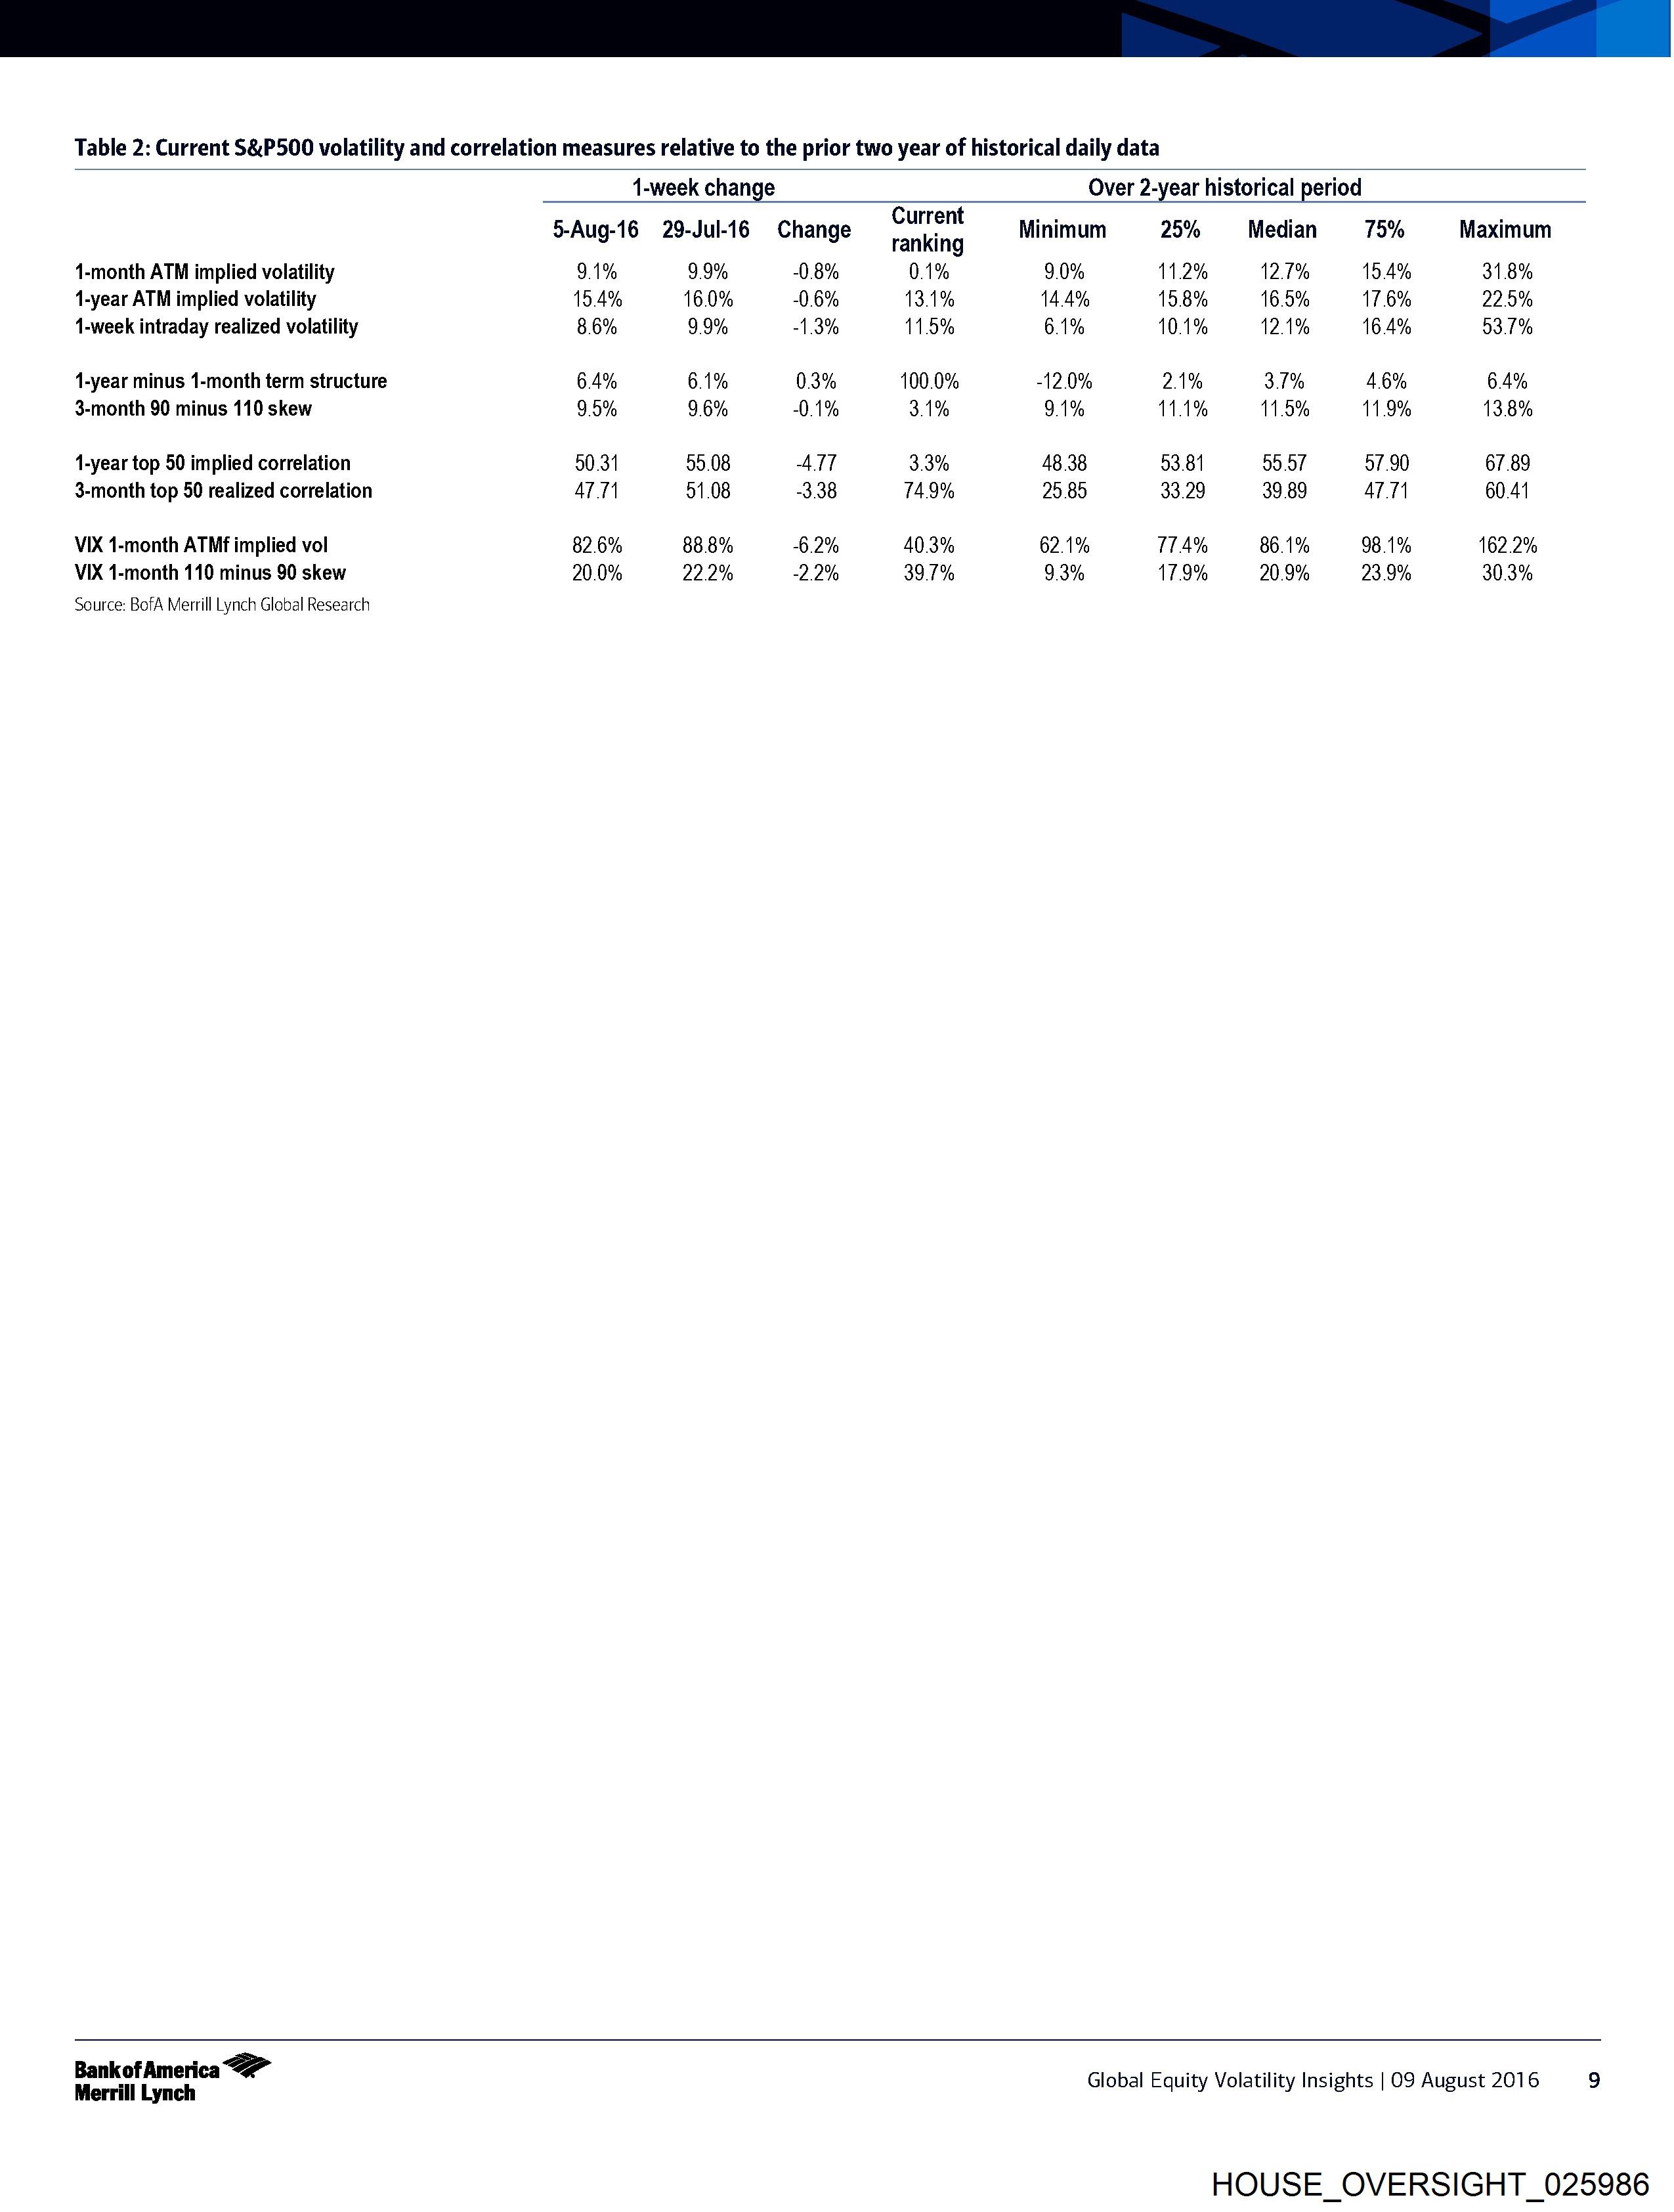
Table 2: Current S&P500 volatility and correlation measures relative to the prior two year of historical daily data
1-week change Over 2-year historical period
5-Aug-16 29-Jul-16 Change ravine Minimum 25% Median 75% Maximum
1-month ATM implied volatility 91% 9.9% -0.8% 0.1% 9.0% 11.2% 12.7% 15.4% 31.8%
1-year ATM implied volatility 15.4% 16.0% -0.6% 13.1% 14.4% 15.8% 16.5% 17.6% 22.5%
1-week intraday realized volatility 8.6% 9.9% -1.3% 11.5% 6.1% 10.1% 12.1% 164% 53.7%
1-year minus 1-month term structure 6.4% 6.1% 0.3% 100.0% -12.0% 2.1% 3.7% 46% 6.4%
3-month 90 minus 110 skew 9.5% 9.6% -0.1% 3.1% 91% 11.1% 11.5% 11.9% 13.8%
1-year top 50 implied correlation 50.31 55.08 ATT 3.3% 48 38 53.81 95.57 57.90 67.89
3-month top 50 realized correlation 4771 51.08 -3.38 14.9% 25.85 33.29 39.89 477 60.41
VIX 1-month ATMf implied vol 82.6% 88.8% 6.2% 40.3% 62.1% TTA% 86.1% 98.1% 162.2%
VIX 1-month 110 minus 90 skew 20.0% 22.2% 2.2% 39.7% 9.3% 17.9% 20.9% 23.9% 30.3%
Source: BofA Merrill Lynch Global Research
Bank of America Global Equity Volatility Insights |O9 August 2016 9
Merrill Lynch
HOUSE_OVERSIGHT_025986
Document Preview

Click to view full size
Document Details
| Filename | HOUSE_OVERSIGHT_025986.jpg |
| File Size | 0.0 KB |
| OCR Confidence | 85.0% |
| Has Readable Text | Yes |
| Text Length | 1,121 characters |
| Indexed | 2026-02-04T16:58:08.387725 |
Related Documents
Documents connected by shared names, same document type, or nearby in the archive.